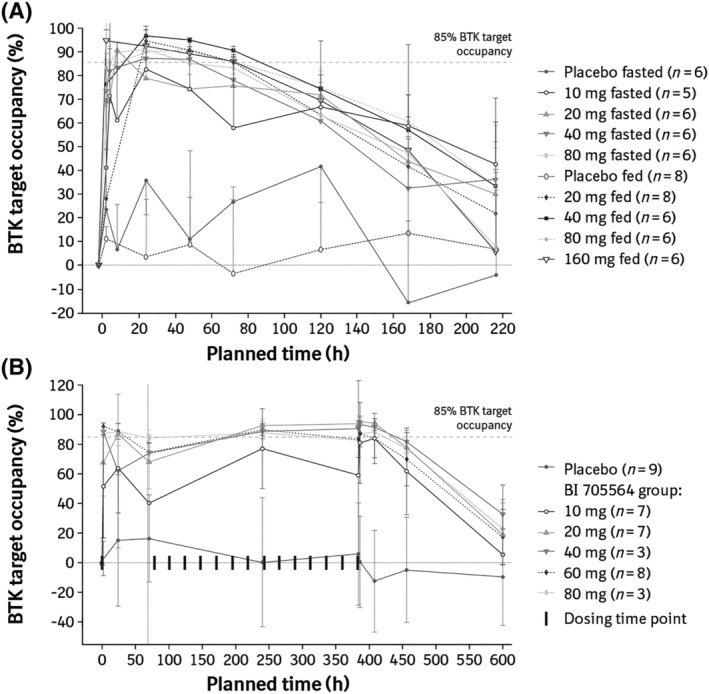
FIGURE 3.

BTK target occupancy in (A) the single‐rising dose studya and (B) the multiple‐rising dose study. (A) Mean BTK TO (+SD) after single‐dose administration of BI 705564 under fasted and fed (high fat) conditions. (B) Mean BTK TO (±SD) after single‐ and multiple‐dose administration of BI 705564 under fed (standard breakfast) conditions. Data are shown for those participants who had sufficient valid data available. The most common reason for exclusion was baseline TO levels being too low for inhibition to be measured. aData for the 1‐ and 3‐mg BI 705564 groups are not presented owing to missing samples and nonvalid data. BTK, Bruton's tyrosine kinase; SD, standard deviation; TO, target occupancy
