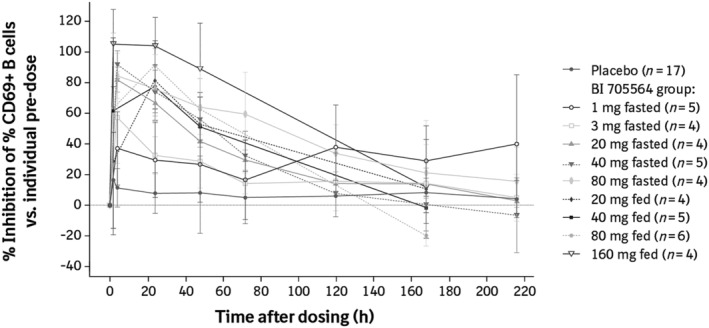
FIGURE 4.

Inhibition of CD69 + B cells after administration of BI 705564 in the single‐rising dose studya. Data are presented as mean ± standard deviation. To evaluate the effect of BI 705564 on B‐cell activation, whole blood samples were stimulated with anti‐IgD, and CD69 + B cells were subsequently measured as a percentage of all CD19 + B cells using flow cytometry. aData for the 10‐mg BI 705564 groups are not presented owing to an insufficient number of participants with a predose stimulation response of >10% CD69 + B cells. IgD, immunoglobulin D
