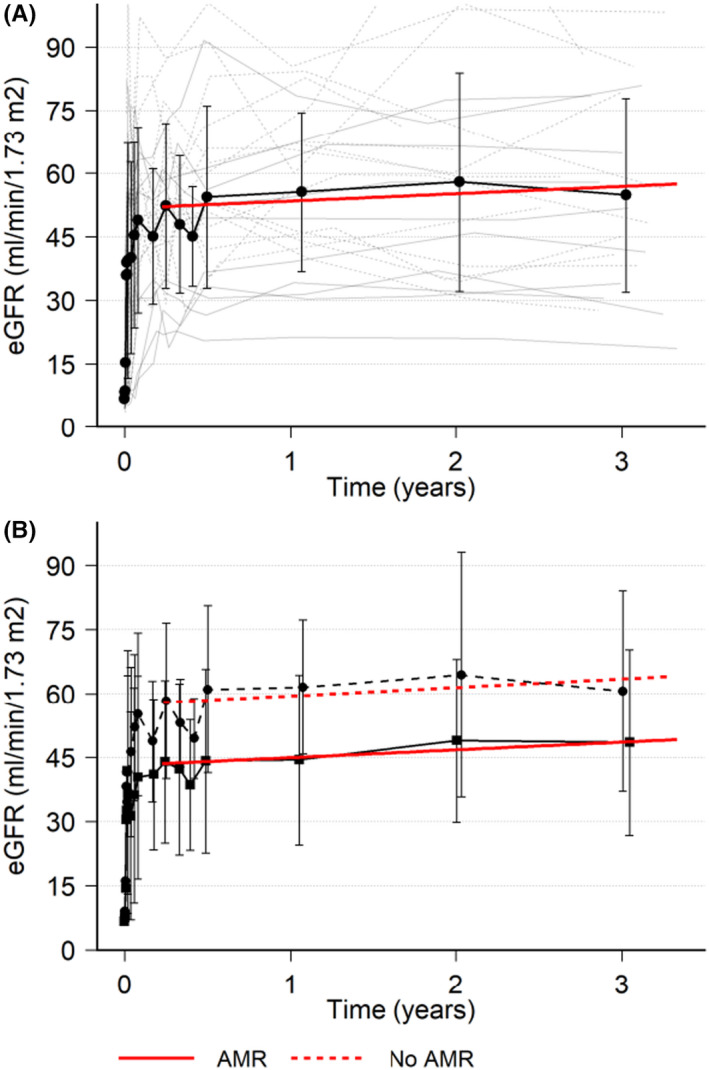
FIGURE 4.

Estimated GFR with MDRD. eGFR with individual patient data (thin gray lines), mean (black line), standard deviation (error bars), and red line is a linear regression from 30 days up to 3 years (A) XM+ patients. (B) XM+ patients separated by AMR (solid lines) or No AMR (dashed lines)
