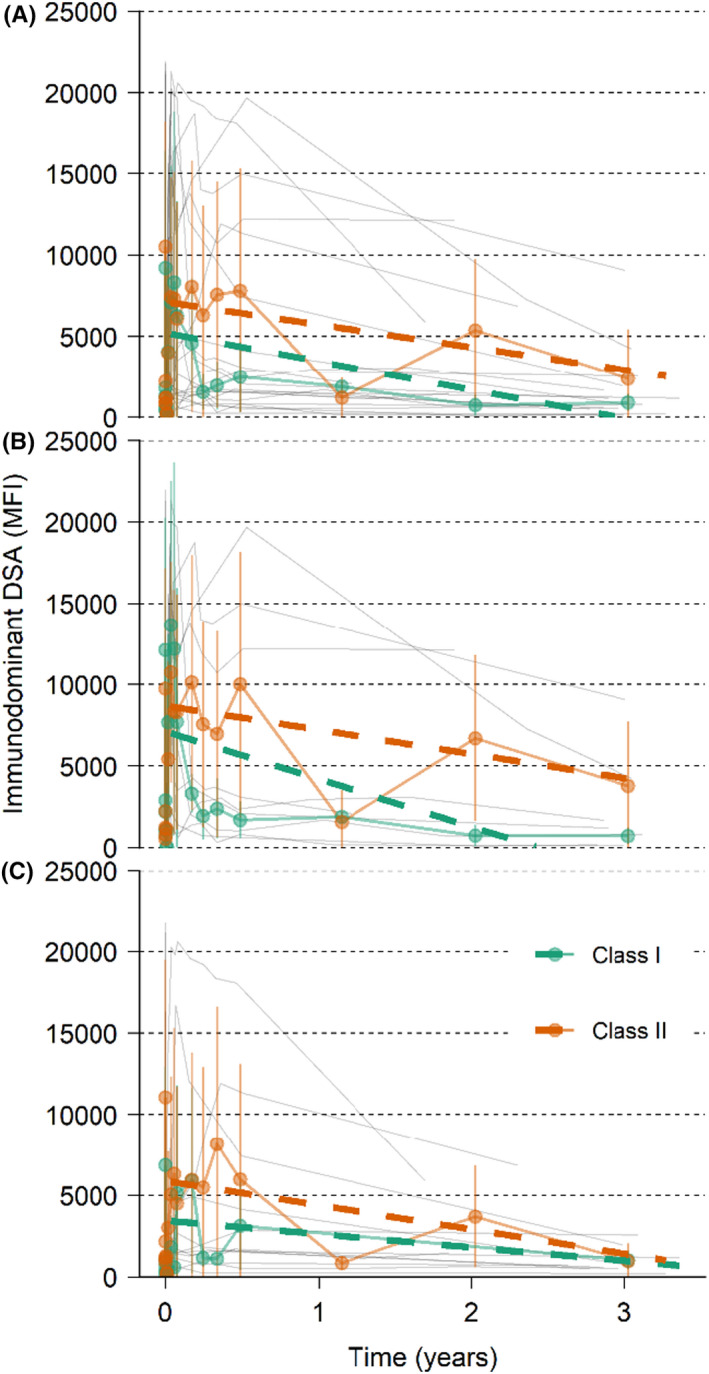
FIGURE 5.

Immunodominant DSA with individual patient data. Immunodominant DSA with individual patient data (thin gray lines), mean (colored lines with points and SD as error bars), and linear regression (dashed colored lines) from 14 days up to 3 years for HLA class I and II. (A) XM+ patients. (B) XM+ patients with AMR. (C) XM+ patients without AMR
