
FIGURE 7.
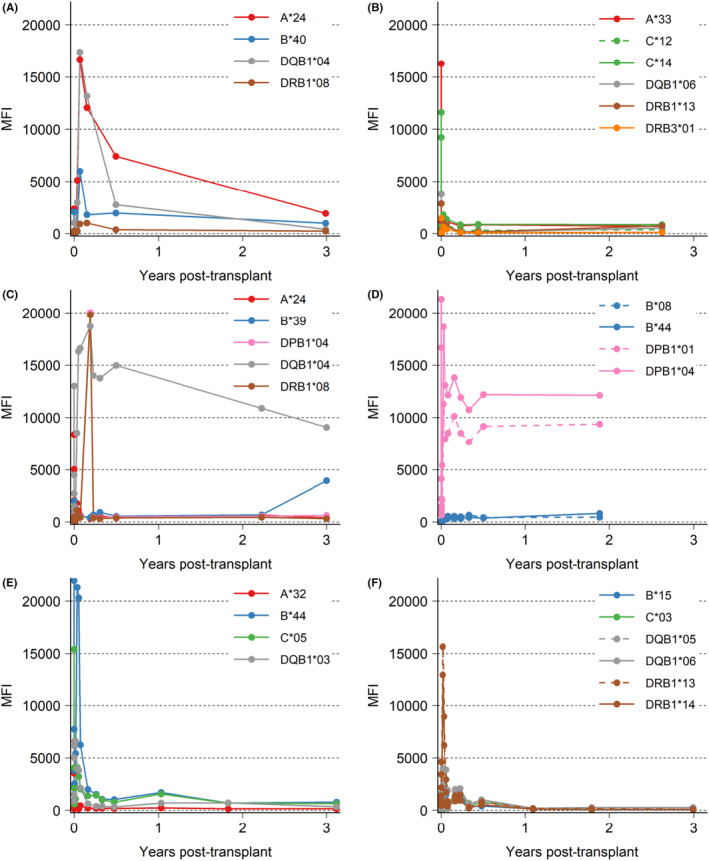
Intensity of 6 patient's individual DSA over time. DSA (MFI ≥ 1000 at any time) for each patient visualized as a line, color depending on HLA‐type, if multiple DSA for one type one line is dashed. (A,B) Patients without AMR, (C–F) patients with AMR