
FIGURE 8.
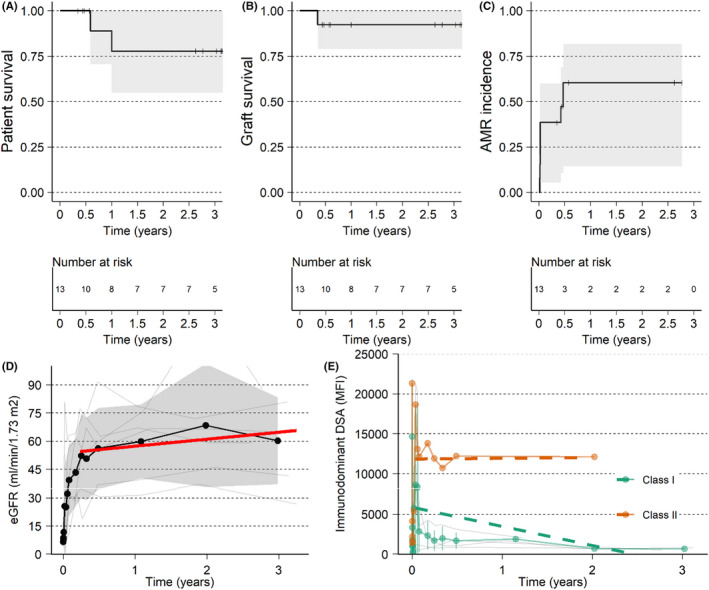
Outcome of the group with XM+, DD, and cPRA ≥ 99.9%. (A) Patient survival. (B) Graft survival, death censored. (C) Time to first AMR. (D) eGFR with individual patient data (thin gray lines), mean (black line with points), standard deviation (gray ribbon) and red line is a linear regression from 30 days up to 3 years. (E) Immunodominant DSA with individual patient data (thin gray lines), mean (colored lines with points and SD as error bars) and linear regression (dashed colored lines) from 14 days up to 2 years for HLA class I and II