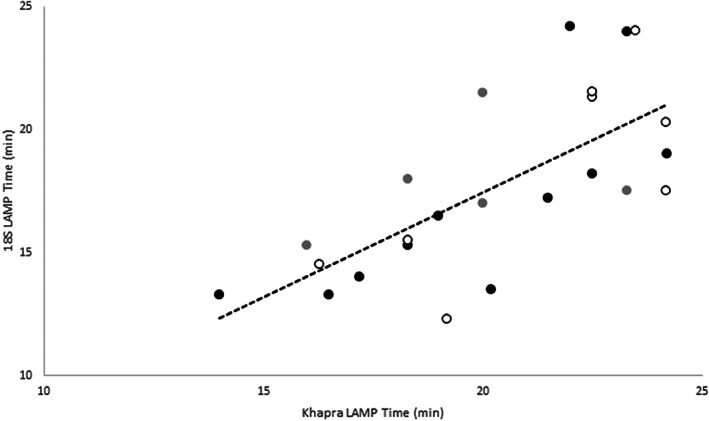
Figure 3.

Comparison of amplification times using the Khapra LAMP and 18S LAMP assays on intercepted Trogoderma granarium specimens (Table 2). DNA extractions (from individual insects): black dots Qiagen columns (n = 11), grey dots HS6 (n = 5), white dots QuickExtract (n = 8) (Table 2). Linear regression line R 2 = 0.50.
