FIGURE 2.

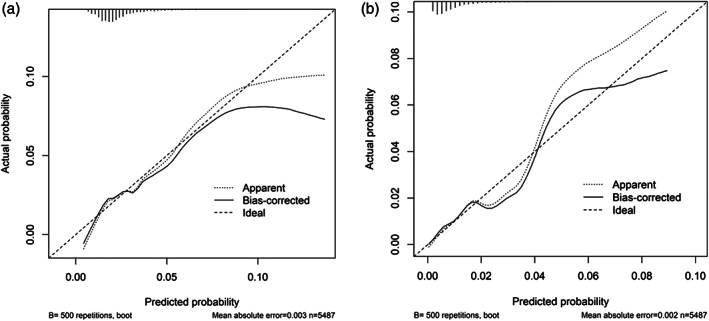
Calibration plots for the prediction of (A) any and (B) major fractures with expected and observed numbers and (percentages) for each quintile. Quintile 3 of any fractures were outside the range of expected values

Calibration plots for the prediction of (A) any and (B) major fractures with expected and observed numbers and (percentages) for each quintile. Quintile 3 of any fractures were outside the range of expected values