FIGURE 3.

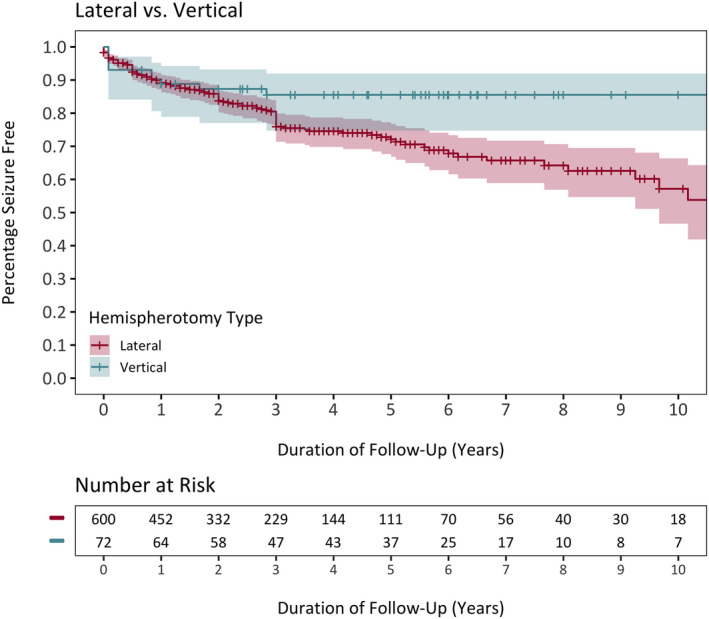
Comparison of Kaplan–Meier curves depicting the seizure freedom functions of vertical and lateral hemispherotomy cohorts

Comparison of Kaplan–Meier curves depicting the seizure freedom functions of vertical and lateral hemispherotomy cohorts