FIGURE 6.
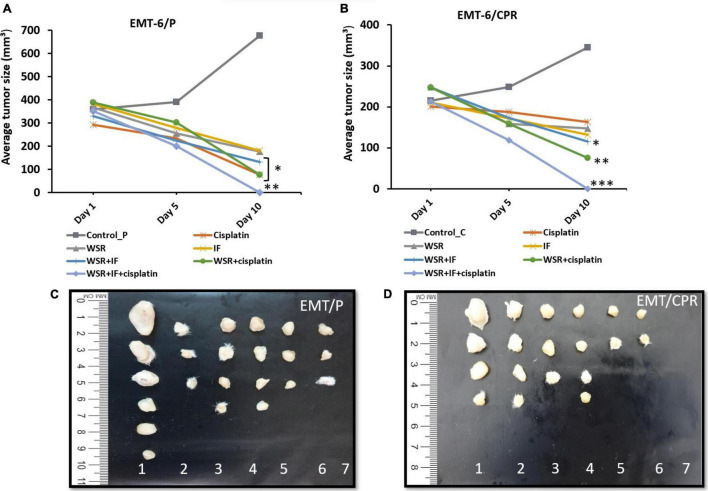
Effect of treatments on tumor size in vivo. (A) A plot of change in average tumor size (mmł) vs. time (days) of treatment in the EMT6/P cell line. (B) A plot of change in average tumor size (mmł) vs. time (days) of treatment in EMT6/CPR cell line. (C) Tumor sizes in EMT6/P cells after dissection on day 10 in all groups compared to each other. (D) Tumor sizes of EMT6/CPR cells after dissection at day 10 in all groups compared to each other. (1 = negative control; 2 = cisplatin; 3 = WSR; 4 = IF; 5 = WSR + IF; 6 = WSR + cisplatin; 7 = WSR + IF + cisplatin). Results are expressed as means ± SEM (n = 6). *P < 0.05, **P = 0.001, ***P < 0.001. (*: treatment groups compared with the control group).

