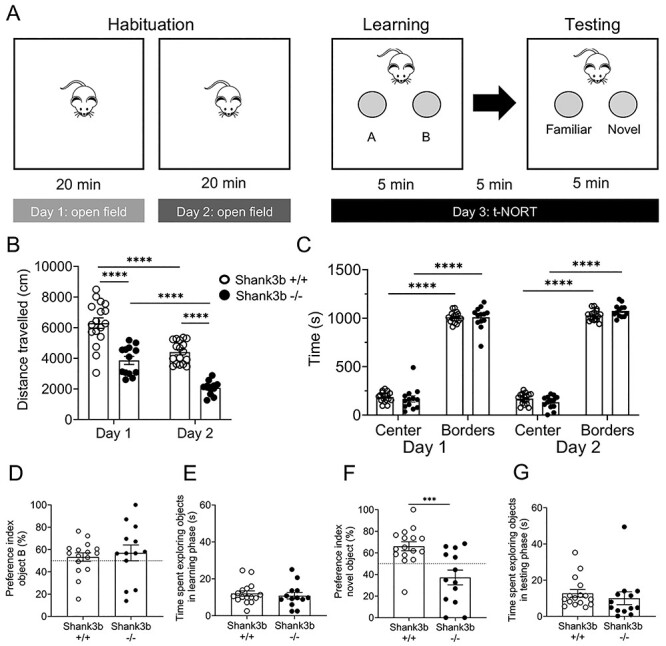
Figure 1 .

Shank3b −/− mice exhibit hypo-locomotion and deficits in texture discrimination. (A) Open field and textured novel object recognition test (tNORT) experimental design. (B and C) Quantification of open field performance by Shank3b+/+ and Shank3b−/− mice. Shank3b−/− mice traveled a significantly shorter distance over the two days of test, as compared to controls (B,****P < 0.0001, Tukey’s test following two-way ANOVA). Both Shank3b+/+ and Shank3b−/− mice spent significantly more time in borders as compared to the center of the arena (C, ****P < 0.0001, Tukey’s test following three-way ANOVA), but the time spent in center and borders did not significantly differ between genotypes (C, P > 0.05, Tukey’s test following three-way ANOVA). (D–G) Quantification of tNORT performance by Shank3b+/+ and Shank3b−/− mice. Preference index (%) for object B (D) and time spent exploring objects in learning phase (E) did not differ between Shank3b+/+ and Shank3b−/− mice (P > 0.05, Tukey’s test following two-way ANOVA). In the testing phase, Shank3b−/− mice showed a significantly lower preference index (%) for the novel object, as compared to Shank3b+/+ mice (F, ***P < 0.001, Tukey’s test following two-way ANOVA), while spending the same time as controls in exploring objects (G, P > 0.05, Tukey’s test following two-way ANOVA). In D and F, the dashed line represents 50% in the preference index, meaning equal preference for both objects. See Materials and Methods for details about preference index calculation. All plots report the mean values ± SEM; each dot represents one animal. Genotypes are as indicated (n = 17 Shank3b+/+ and 13 Shank3b−/− for open field; n = 16 Shank3b+/+ and 13 Shank3b−/− for tNORT; one Shank3b+/+ mouse was excluded from tNORT analysis as it did not interact with objects during the learning phase).
