
Figure 5 .
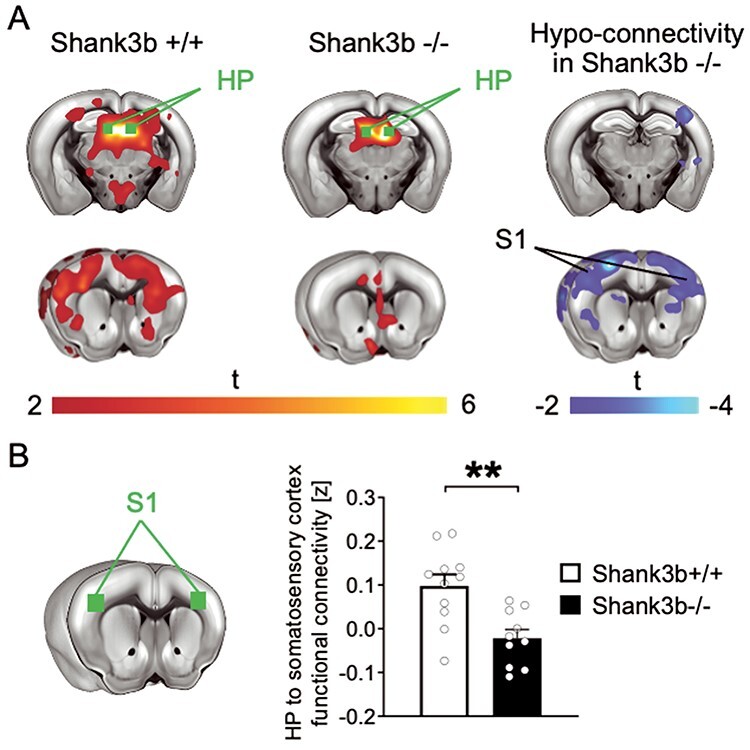
Impaired functional connectivity between hippocampus and primary somatosensory cortex (S1) in Shank3b−/− mice. (A) Seed-based connectivity maps of the dorsal hippocampus in Shank3b+/+ and Shank3b−/− mice. Red-yellow represents brain regions showing significant rsfMRI functional connectivity with the dorsal hippocampus (HP) in Shank3b+/+ (left) and Shank3b−/− mice (middle). Seed region is depicted in green. Brain regions showing significantly reduced rsfMRI connectivity in Shank3b−/− mutants with respect to Shank3b+/+ control littermates are depicted in blue/light blue (right). (B) Functional connectivity was also quantified in reference volumes of interest (green) placed in S1. Error bars represent SEM. **P < 0.01 (unpaired t-test, n = 11 Shank3b+/+ and 10 Shank3b−/−; each dot represents one animal). Genotypes are as indicated.