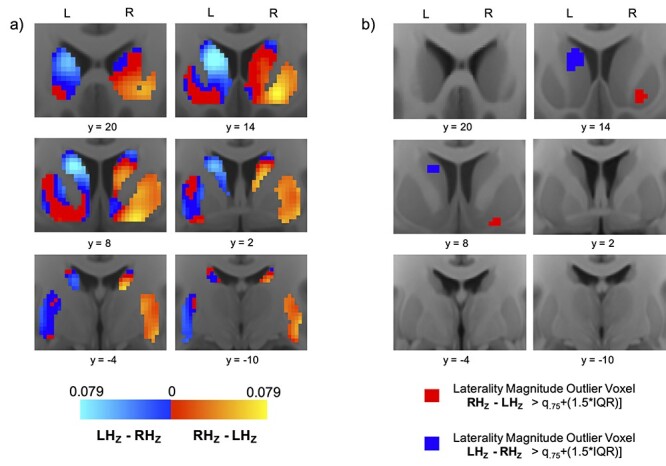
Figure 2.

Pars opercularis connectivity laterality: heatmaps and hotspots. (a) Average voxel-wise heatmaps of laterality in pars opercularis functional connectivity in the left and right striatum. Warm spectrum colors indicate voxels whose connectivity with right pars opercularis is stronger than their connectivity with left pars opercularis. Cooler spectrum colors indicate voxels whose connectivity with left pars opercularis is stronger than their connectivity with right pars opercularis. Brighter hues on each spectrum denote higher levels of laterality. (b) Maps highlighting laterality “hotspot” voxels where the difference between connectivity with left and right pars opercularis constitutes an extreme (outlier) in the distribution.
