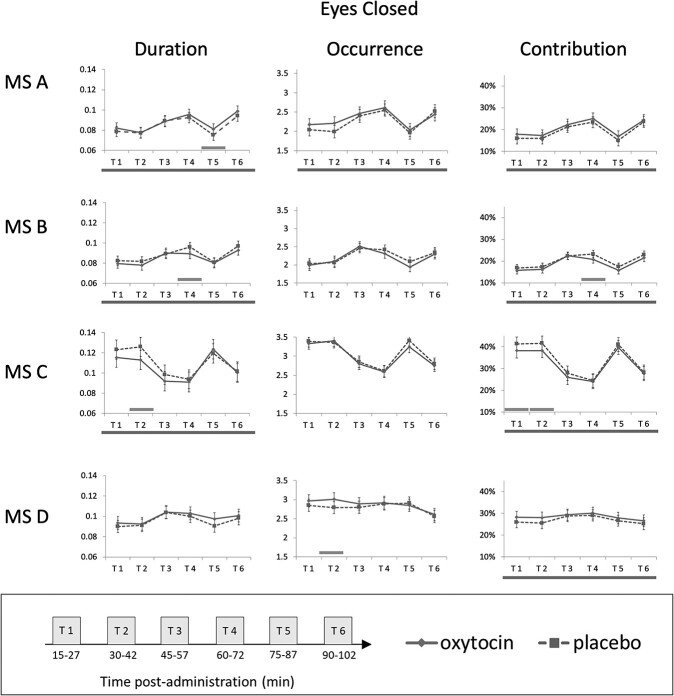
Figure 1.
IN-OT- and PL-induced changes in the microstate features for the eyes-closed condition over the post-administration observation period. Dashed line corresponds to placebo and continuous line to oxytocin. For each subplot, bottom line across all time windows signals a main effect of drug. Significant pairwise comparisons (oxytocin vs. placebo) at specific time windows are signaled with a green bar above the x axis. Error bars: 95% Cl. Time windows: 1 = 15—27 min after drug (IN-OT/PL) administration, 2 = 30–42 min, 3 = 45–57 min, 4 = 1 h–1 h12min, 5 = 1 h15 min–1 h27min, 6 = 1 h30 min–1 h42 min. MS = microstate.

