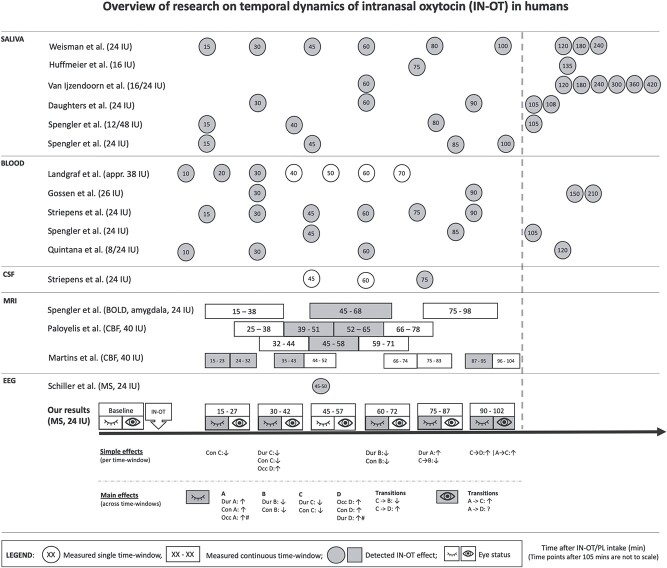
Figure 3.
An overview of our experiment’s time frame (time windows with a significant, P < 0.05, effect of drug are highlighted in grey, including two borderline-significant trends distinguished with #) in comparison with that of all previous pharmacodynamics studies and the only microstates EEG using IN-OT (time windows with a significant effect of drug are highlighted in grey). Appr. = approximately, BOLD = blood oxygenation level dependent, CBF = cerebral blood flow, CSF = cerebrospinal fluid, EEG = electroencephalography, IN-OT = intranasal oxytocin, IU = international units, MRI = magnetic resonance imaging, MS = microstates, PL = placebo, Dur = duration, Con = contribution, Occ = occurrence, Tran = transition.

