Figure 3.

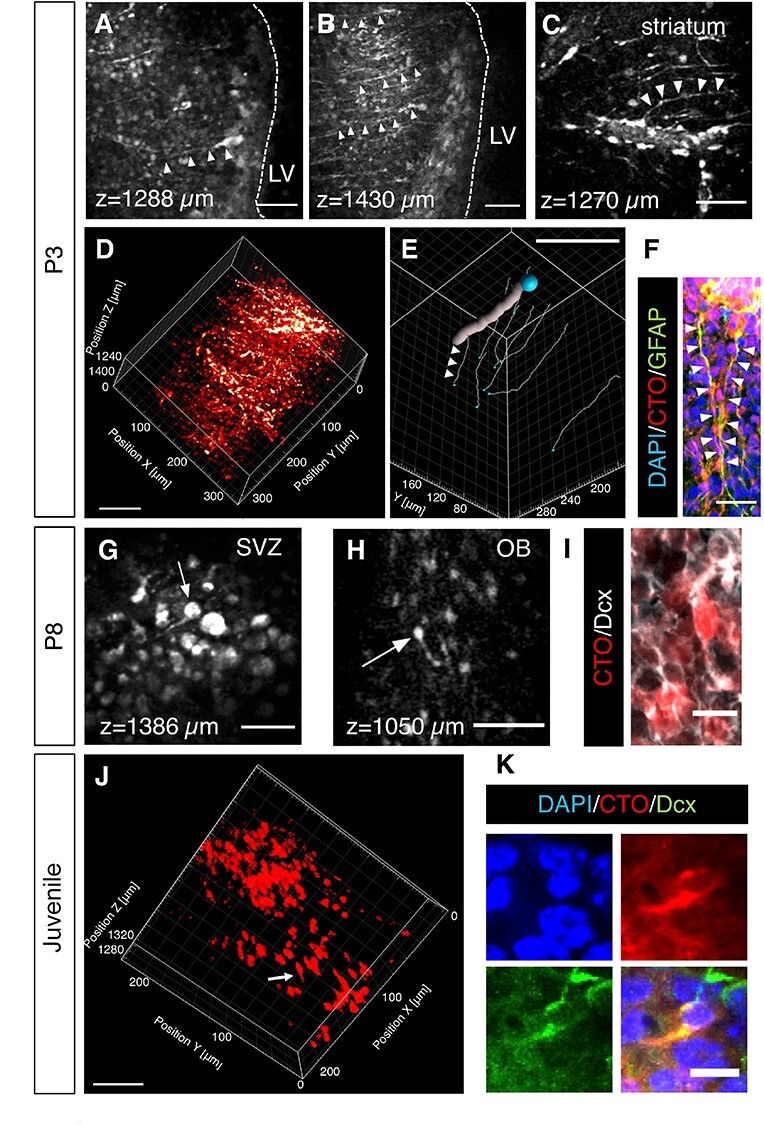
3PM imaging of SVZ and OB cell types. (A–C) Representative 3PM XY images of RGC like neural stem cells at different depths of P3 pups (2 dpi). Arrowheads indicate neural stem cells. (D) 3D reconstruction of white matter and SVZ from the depth of 1150–1472 μm of P3 pups (see Supplementary Movie 3). (E) Filament tracking in 3D reconstruction (D). The thick line indicates a blood vessel and the thin lines (ex. arrowheads) indicate individual cellular processes from different 3PM-imaged NSCs (see Supplementary Video 4). The blue balls indicate tracing starting points. (F) Immunostaining of GFAP in SVZ. The arrowheads indicate the basal processes of two neural stem cells labeled by both CTO and GFAP. (G, H) Representative 3PM XY images of neuroblasts at the depth of 1386 μm in SVZ (G) or 1050 μm in OB (H) of P8 pups (7 dpi). The arrows indicate neuroblasts. (I) Immunostaining of Dcx in OB confirming that CTO+ cells neuroblasts. (J) 3D reconstruction of the SVZ from the depth of 1271–1325 μm in a juvenile mouse (3 dpi; See Supplementary Video 5). The arrow points to a cell with migratory morphology. (K) Immunostaining showing a Dcx + cell in the SVZ labeled with CTO. Scale bars represent 50 μm in A, B, C, G, H, J; 80 μm in D; 100 μm in E; 20 μm in F; 10 μm in I and K.
