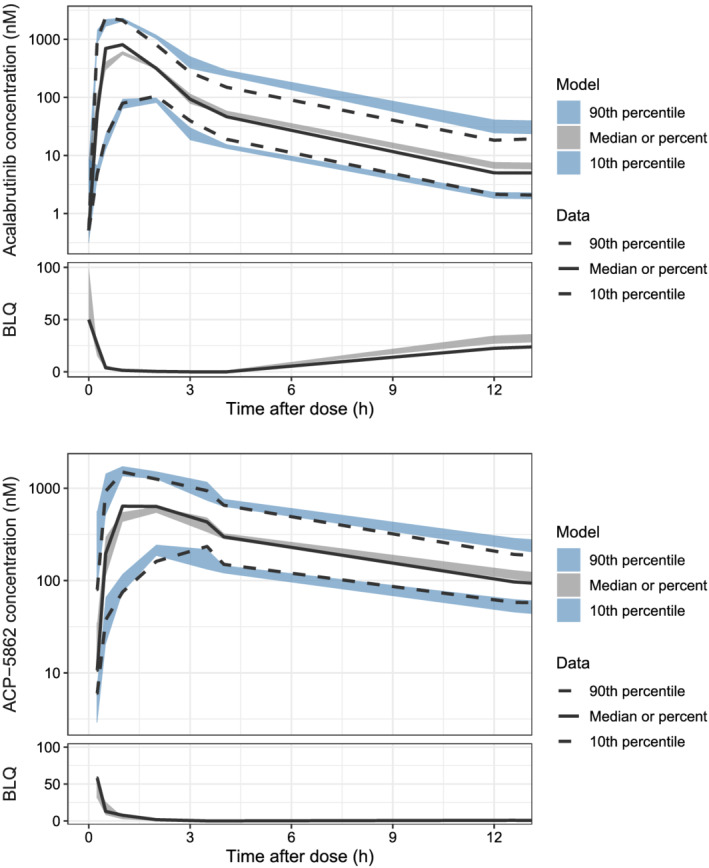
FIGURE 1.

Prediction‐corrected visual predictive check for the final model (12‐hour profile). The top panels show acalabrutinib data and the bottom show ACP‐5862 data on log‐scale. The observed data have been omitted to better visualize the percentiles. The solid and dashed lines are the median and the 10th and 90th percentiles of the observations. The shaded areas are the 95% confidence intervals of the median and the 10th and 90th percentiles predicted by the model. Note: prediction correction could result in values originally above lower limit of quantification to appear to be below (BLQ) after the correction (2.1 nM and 10 nM for acalabrutinib and ACP‐5862, respectively)
