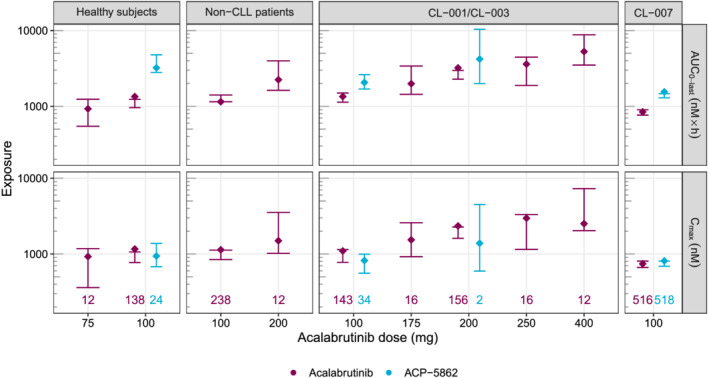
FIGURE 2.

Posterior predictive check of final model for acalabrutinib and ACP‐5862 AUC0‐last (top row) and Cmax (bottom row) by dose group. Studies with a similar sampling schedule have been grouped (columns). Diamonds represent the computed median AUC0‐last or Cmax on the observed data (across subjects and rich occasions). The coloured numbers at the bottom of each column represent the number of rich occasions for each scenario. Error bars represent the 95% confidence intervals based on 300 simulations. AUC0‐last, area under the concentration–time curve from time 0 to last observation; CLL, chronic lymphocytic leukaemia; Cmax, maximum plasma concentration
