
FIGURE 5.
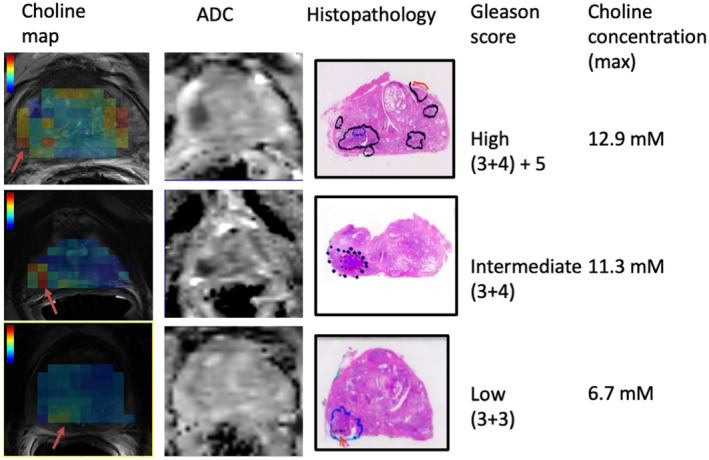
Representative transversal slices with 1H‐MRS choline maps on top of T2‐weighted MR images (left‐hand side) and ADC maps and corresponding prostate prostatectomy histopathology slices with tumor delineation from 3 patients with high, intermediate, and low‐risk cancer lesions. Areas with low ADC values seen on the ADC maps of intermediate and high‐risk lesions co‐localize with tumor foci identified by histopathology. For all lesions, these tumor foci correspond with increased choline levels. The maximum choline tissue concentrations in the tumor areas (from voxels with red arrow) are presented on the right‐hand side and increase with Gleason score–based risk category. The color bars indicate choline concentrations in the range of 2 to 14 mM