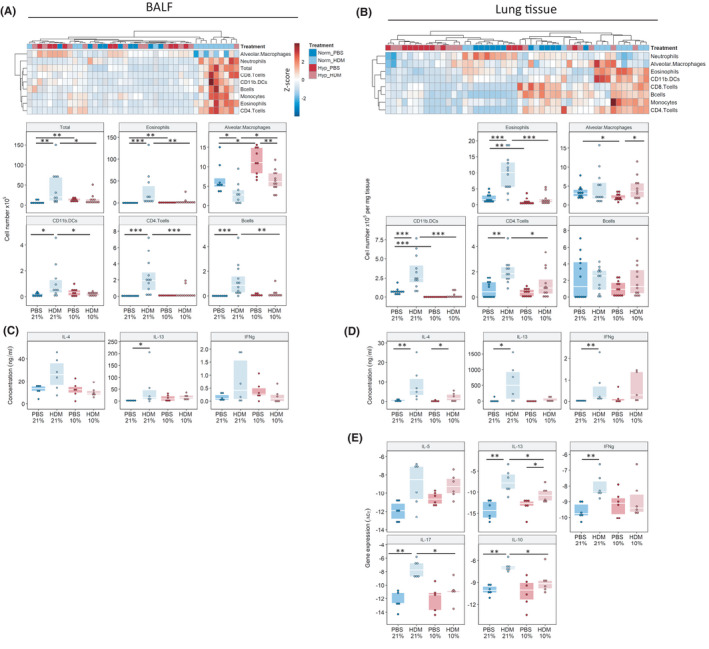
FIGURE 2.

Exposure to low oxygen conditions attenuates the HDM‐induced immune response. Flow cytometry analysis of inflammatory cell content in the bronchiolar alveolar lavage fluid (BALF), (left panels) and lung tissue (right panels). (AB) Heat map representation of all analysed inflammatory cell populations using log10+1 transformed values, cell populations are z‐scaled with red indicating highest abundance and blue lowest. Total cell counts (BALF) and cell counts normalized to lung weight (Lung tissue) are also represented by dotplot with boxplot overlays. Analysis of inflammatory cytokines in (C) BALF and (D) lung tissue via ELISA and via (E) qPCR in the lung. Gating strategy in Figures [Link], [Link]. *p < .05, **p < .01, ***p < .001
