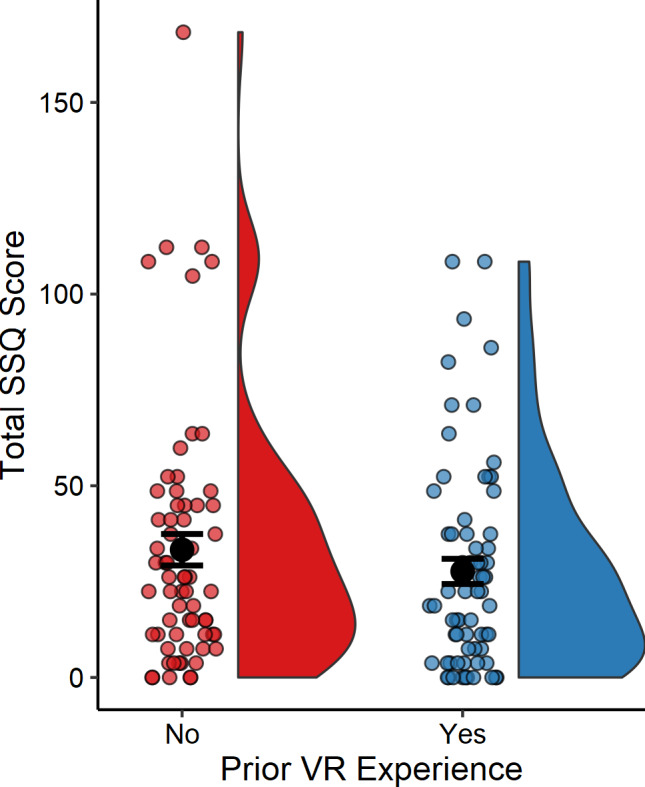
Fig. 4.

Participant’s total SSQ scores according to whether they had or had not experienced virtual reality before. Smaller coloured circles represent the scores of individual participants, whereas the larger black circles indicate the means for each group. Error bars indicate standard error, and the data distributions are represented to the right of each mean.
