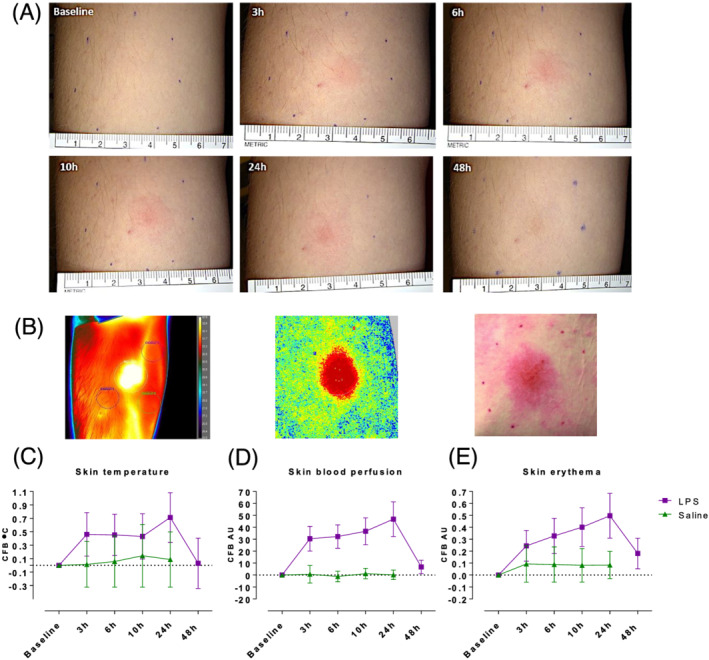
FIGURE 1.

The clinical response after 5 ng lipopolysaccharide (LPS) vs. saline injection. At baseline and at the indicated time‐points post‐LPS or saline injection, skin assessments were performed quantifying temperature, perfusion and erythema. (A) Representative images from standardized photography at the indicated time‐points. (B) Representative images from thermography, laser speckle contrast imaging and erythema photo analysis from LPS injected skin at 24 hours post‐LPS injection. (C–E) LPS increased skin temperature (thermography), blood perfusion (laser speckle contrast imaging) and erythema (photo analysis) in the skin compared to saline injected skin. All data are expressed as change from baseline, means ± standard deviation. For all 3 parameters the contrast between LPS and saline was calculated using mixed model analysis of variance up to 24 hours postinjection and was highly significant (P < .0001)
