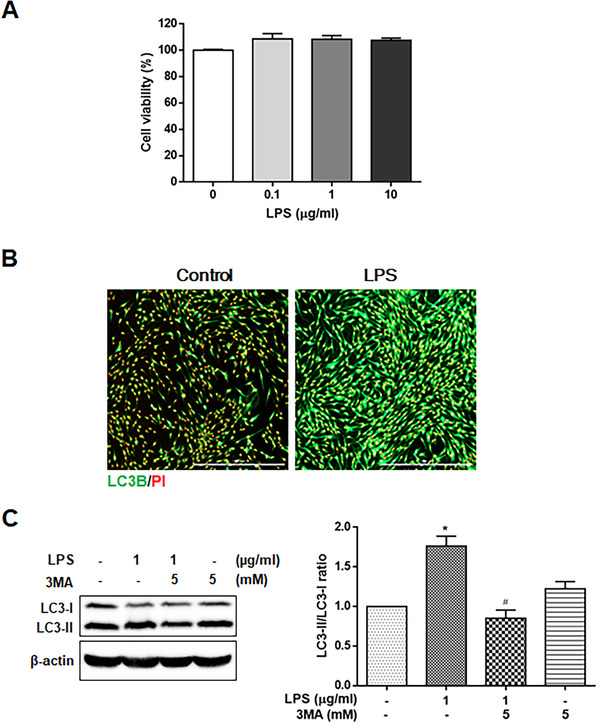
FIGURE 3.

Expression of autophagy marker in LPS‐stimulated HGFs. (A) Cell viability was determined by the MTT assay in HGFs treated with 0.1, 1, and 10 μg/mL LPS. (B) Immunocytochemical analysis was performed to detect LC3B‐positive cells (green) in HGFs treated with 1 μg/mL of LPS for 24 hours. (C) The expression of LC3‐II was detected by Western blot analysis in HGFs treated with 1 μg/ml LPS for 24 hours with or without 5 mM 3MA pretreatment for 1 hour. Each protein was quantitated using densitometry and normalized to β‐actin. The data are expressed as the mean ± SD of triplicate independent experiments. Scale bars, 1000 μm. HGFs, human gingival fibroblasts; LPS, lipopolysaccharide; MTT, 3‐(4,5‐dimethylthlazol‐2yl)‐2,5‐diphenyl‐tetrazolium bromide. *p < 0.05 vs. untreated cells. # p < 0.05 vs. LPS‐treated cells
