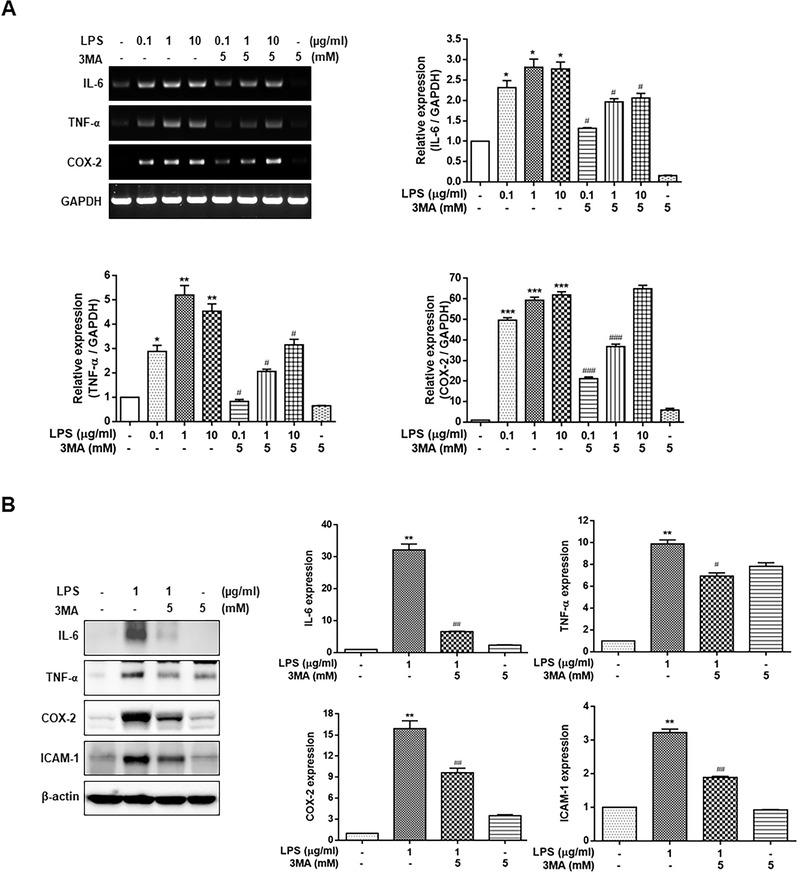
FIGURE 4.

Effect of autophagy inhibition on the expression of inflammatory cytokines in LPS‐stimulated HGFs. The cells were treated with 0.1, 1, and 10 μg/mL LPS (A) or 1 μg/mL LPS (B) for 24 hours, with or without 5 mM 3MA pretreatment for 1 hour. The expression of IL‐6, TNF‐α, and COX‐2 was measured using RT‐PCR or Western blot analysis. Each protein was quantitated using densitometry and normalized to GAPDH or β‐actin. The data are expressed as the mean ± SD of triplicate independent experiments. 3MA, 3‐methyladenine; COX‐2, cyclooxygenase‐2; HGFs, human gingival fibroblasts; IL‐6, interleukin‐6; LPS, lipopolysaccharide; RT‐PCR, real‐time polymerase chain reaction; TNF‐α, tumor necrosis factor‐α. *p < 0.05, **p < 0.01, ***p < 0.001 vs. untreated cells, # p < 0.05, ## p < 0.01, ### p < 0.001 vs. LPS‐treated cells
