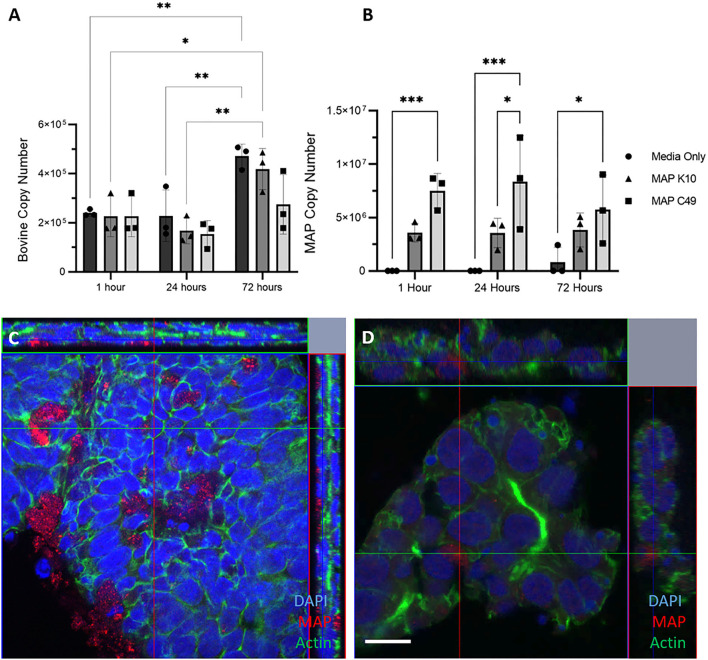
Figure 5.
Infection of basal-out 3D enteroids with 2 different strains of MAP. Enteroids were infected with an MOI of 100 in 3 biological replicates using enteroids generated from the same calf at passage 15, 17 and 20. The bovine (A) and bacterial (B) cell number was quantified using qPCR for the spastin gene and F57 sequence element respectively via qPCR (data presented as mean ± SD). Statistical analysis performed using 2-way ANOVA followed by a post hoc Tukey's test. P < 0.05 = *; P < 0.01 = **; P < 0.001 = ***; P < 0.0001 = ****. (C–D) Immunofluorescence microscopy images of infected 3D enteroids 24 h post infection. Enteroids were stained for nuclei (DAPI, blue), F-actin (Phalloidin, green) and MAP (anti-MAP, red). 3D enteroids are shown as a cross section from Z-stack images infected with MAP K10 (C) and MAP C49 (D). Scale bar = 10μm.

