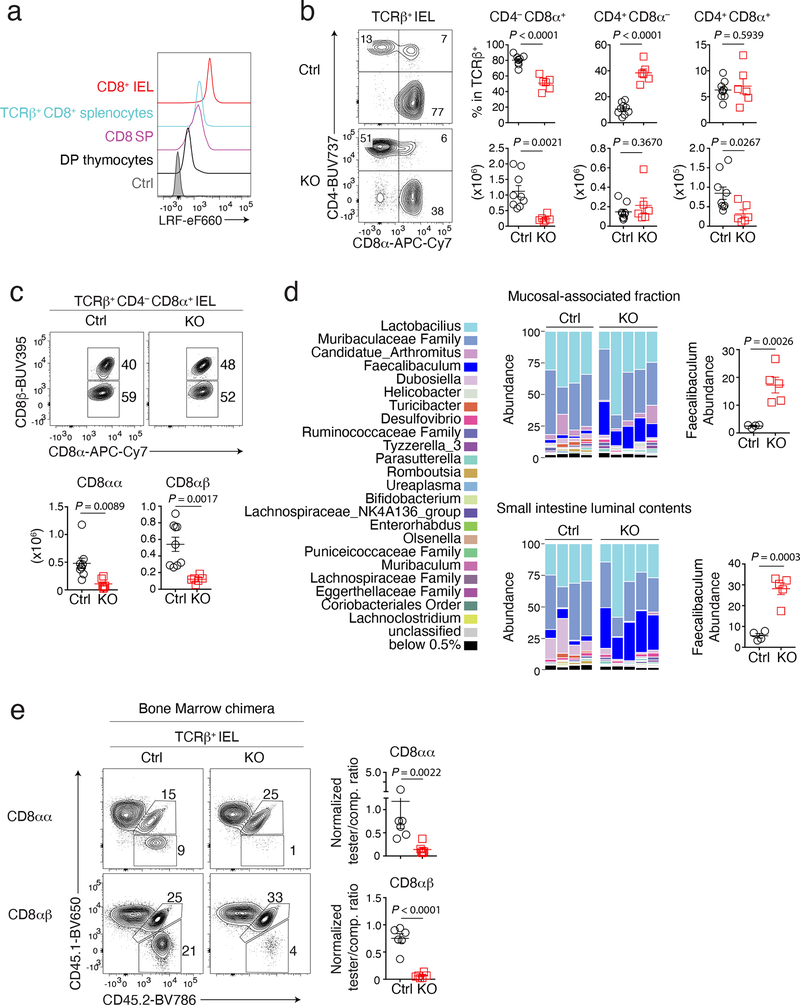
Figure 1. LRF is needed for IEL development.
(a) Stacked histograms show LRF expression in indicated wild-type cells and in TCRβ+ CD4−CD8+ splenocytes from LRF KO mice as a control (grey-shaded). Data are from one experiment representative of two.
(b) Contour plots on the left show CD8α vs. CD4 expression on TCRβ+ IEL from Ctrl and LRF KO mice. Graphs (right) show the percentage (top) and absolute number (bottom) of TCRβ+ cells in indicated IEL subsets. Data pooled from four independent experiments with a total of 9 Ctrl and 6 LRF KO mice; each symbol represents one mouse.
(c) Flow cytometric expression of CD8α vs. CD8β in TCRβ+ CD4−CD8α+ IEL from Ctrl and LRF KO mice (top). The bottom graphs show the total number of CD4− CD8α+ CD8β− (CD8αα, left) and CD4− CD8α+ CD8β+ (CD8αβ, right) IEL. Data pooled from three independent experiments with a total of 9 Ctrl and 6 LRF KO mice, each symbol represents one mouse.
(d) Graph shows microbiota distribution (percent of total species) in the small intestine mucosal-associated fraction (top) and luminal contents (bottom) from Ctrl (n = 4) and LRF KO (n = 5) mice. Data are from one experiment representative of two, each column represents one mouse. Graphs on the right show the percentage of Faecalibaculum in indicated conditions.
(e) Expression of CD45.1 vs. CD45.2 in CD8αα (top) and CD8αβ (bottom) IEL from irradiated CD45.1+ host mice reconstituted with CD45.2+ tester (either Ctrl or LRF KO, n = 6 per group) and CD45.1+CD45.2+ competitor (comp.) bone marrow mixed with a 1:1 ratio. Graphs (right) show tester/competitor ratios in IEL subsets, normalized to tester/competitor ratio of B220+ splenocytes in the same mouse. Data pooled from two independent experiments, totaling 6 mice per group. Each symbol represents one mouse.
(b, c, d and e): Error bars indicate standard error of the mean (SEM). P values are from two-tailed unpaired t-test.

