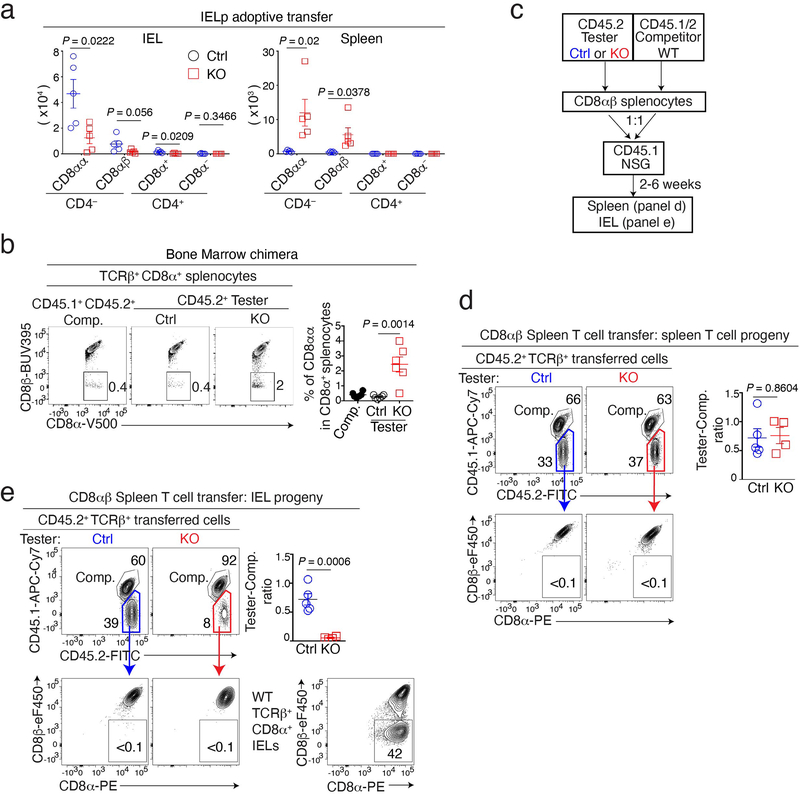
Extended Data Fig. 3. Impact of LRF on IELp homing.
(a) Graph shows the absolute number of the indicated TCRβ+ tester cells (Ctrl or LRF KO) among IEL or spleen T cells analyzed in Fig. 3ab. Data are from one experiment (5 mice per group) representative of two.
(b) CD8α vs. CD8β expression on TCRαβ+ CD8α+ splenocytes from bone marrow chimera analyzed in Fig. 1e. Graph (right) shows the percentage of CD8αα cells among TCRαβ+ CD8α+ splenocytes. Data pooled from two independent experiments with a total of 6 mice per group. Each symbol represents one mouse.
(c-e) NSG host mice were adoptively transferred with a 1:1 mixture of CD45.2+ tester (either Ctrl or LRF KO) and CD45.1+CD45.2+ competitor CD8αβ splenocytes, and analyzed one week after transfer. Data are from one experiment (5 Ctrl and 4 KO mice) representative of two.
(c) Schematic of the experiment
(d, e) Top contour plots show CD45.2 vs. CD45.1 expression in TCRβ+ CD45.2+ splenocytes (d) and IEL (e). Colored boxes define Ctrl (blue) and KO (red) testers populations assessed for CD8α vs. CD8β expression in bottom contour plots. Top right graphs show tester/competitor ratios in each organ. Each symbol represents one mouse. Bottom right panel in (e) shows CD8α vs. CD8β expression on CD8α+ IEL from an unmanipulated C57BL/6 (WT) mouse.
Error bars indicate standard error of the mean (SEM). P values (a, b, d, e) are from two-tailed unpaired t-test.

