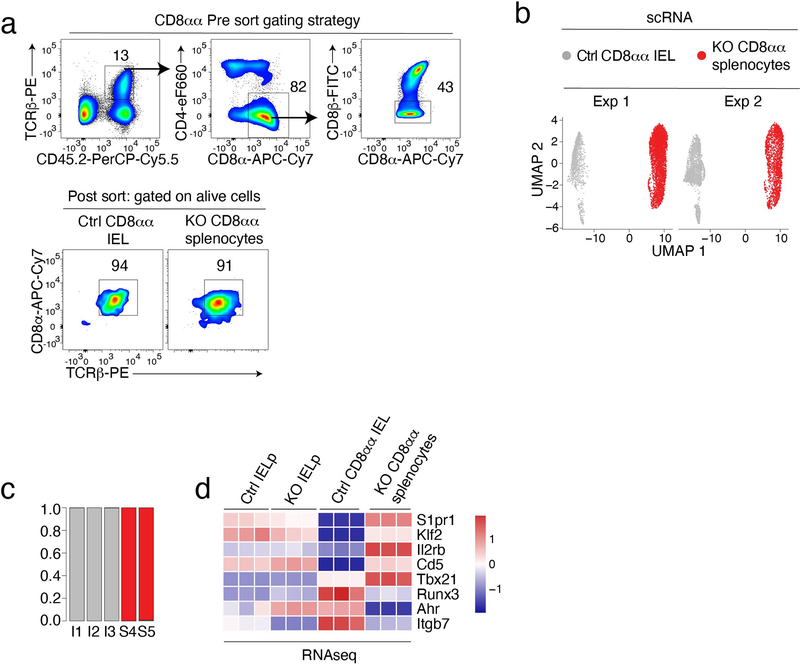
Extended Data Fig. 6. Control of IEL gene expression by LRF.
(a-d) scRNAseq of CD8αα IEL from Ctrl and CD8αα splenocytes from KO mice.
(a) Top plots show sorting strategy for CD8αα splenocytes and CD8αα IEL purification. Bottom graphs show the purity of indicated sorted subsets used for scRNAseq analyses (Fig. 7c–f).
(b) UMAP plot of Ctrl CD8αα IEL and KO CD8αα splenocytes, as in Fig. 7c, displayed separately for each experiment and color-coded by genotype.
(c) Bar plots indicate the Ctrl (gray) vs. LRF KO (red) genotype distribution of CD8αα clusters referred to in Fig. 7c–f.
(d) Heatmap shows row-standardized expression of selected genes among triplicate RNAseq samples from the indicated populations (color scale at right).

