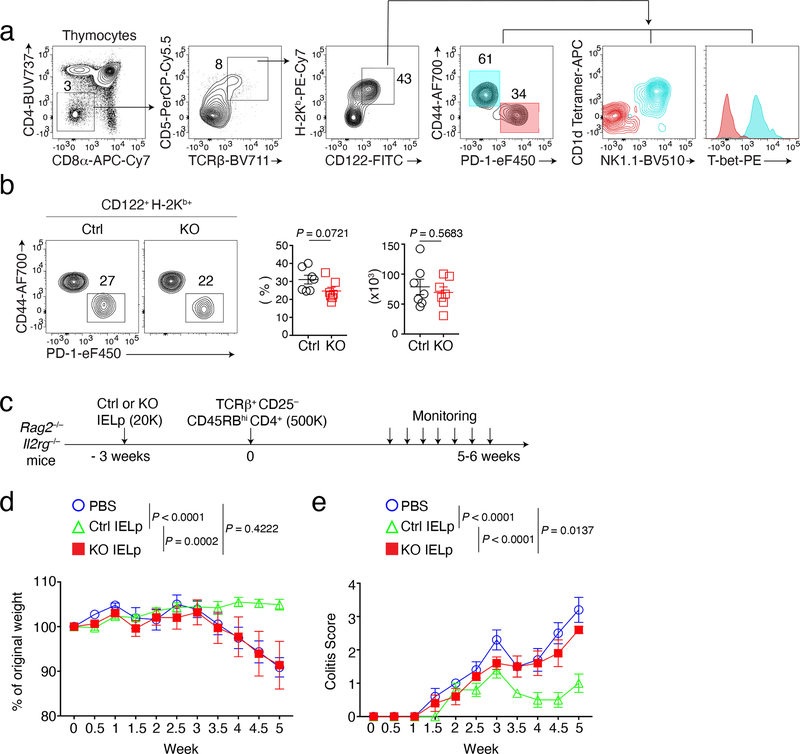
Figure 2. LRF is required for IELp immune regulatory functions.
(a) Gating strategy for analysis of thymic IELp. Cyan and red color represent CD44+ cells and IELp respectively.
(b) Flow cytometry analysis of IELp from Ctrl and LRF KO mice (n = 7 per group). Representative contour plots (left) show expression of CD44 vs. PD-1 on CD4− CD8α− TCRβ+ CD5+ H-2Kb+ CD122+ cells in the thymus from Ctrl and LRF KO mice. Graphs show the percentage (middle) of IELp (CD44− PD-1+ cells) among CD4−CD8− TCRβ+ CD5+ H-2Kb+ CD122+ thymocytes and the absolute number (right, each symbol represents one mouse) of IELp. Data pooled from five independent experiments.
(c) Schematic of adoptive transfer colitis experiments in Rag2–/–Il2rg-–/– mice. K indicates 1000 cells.
(d, e) Rag2–/–Il2rg-–/– mice were adoptively transferred with TCRβ+ CD4+ CD25−CD45RBhi splenocytes from C57BL/6 mice 3 weeks after receiving either PBS, Ctrl IELp or LRF KO IELp at time 0, as schematized in (c)(n=5 per group). Graphs show changes in body weight (d) and colitis scores (e) post CD4+ T cell transfer. Data are from one experiment representative of two (n=5 per group in each experiment).
Error bars indicate standard error of the mean (SEM). P values are from two-tailed unpaired t-test (b) or two-way ANOVA (d, e).

