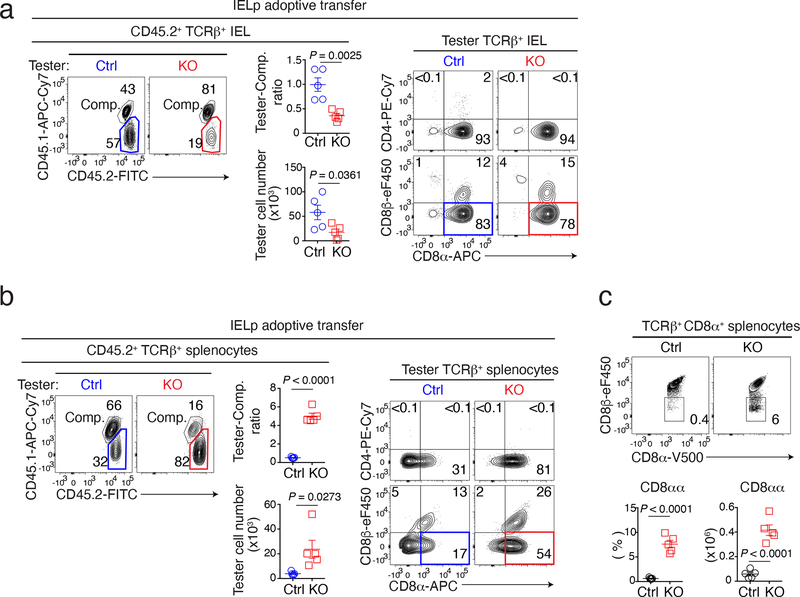
Figure 3. LRF is required for IELp gut homing.
(a, b) Contour plots show CD45.1 vs. CD45.2 expression (left) or CD8α vs. CD4 or CD8β expression (right panels) in TCRβ+ CD45.2+ IEL (a) and splenocytes (b) from NSG host mice transferred with a 1:1 mix of CD45.2+ tester (either Ctrl or LRF KO, n = 5 per group) and CD45.1+CD45.2+ wild-type competitor IELp. Summary graphs (middle, each symbol represents one mouse) show tester/competitor ratios (top) and absolute number of CD45.2+ tester cells (bottom) in IEL (a) and spleen (b). Data are from one experiment representative of two.
(c) Contour plots show CD8α vs. CD8β expression on TCRβ+ CD8α+ splenocytes from Ctrl and LRF KO mice (top). Bottom graphs show the percentage (left) of CD8αα cells in TCRβ+ CD8α+ splenocytes and absolute number (right) of CD8αα cells. Data pooled from three independent experiments with a total of 5 mice per group. Each symbol represents one mouse.
Error bars indicate standard error of the mean (SEM). P values (a-c) are from two-tailed unpaired t-test.

