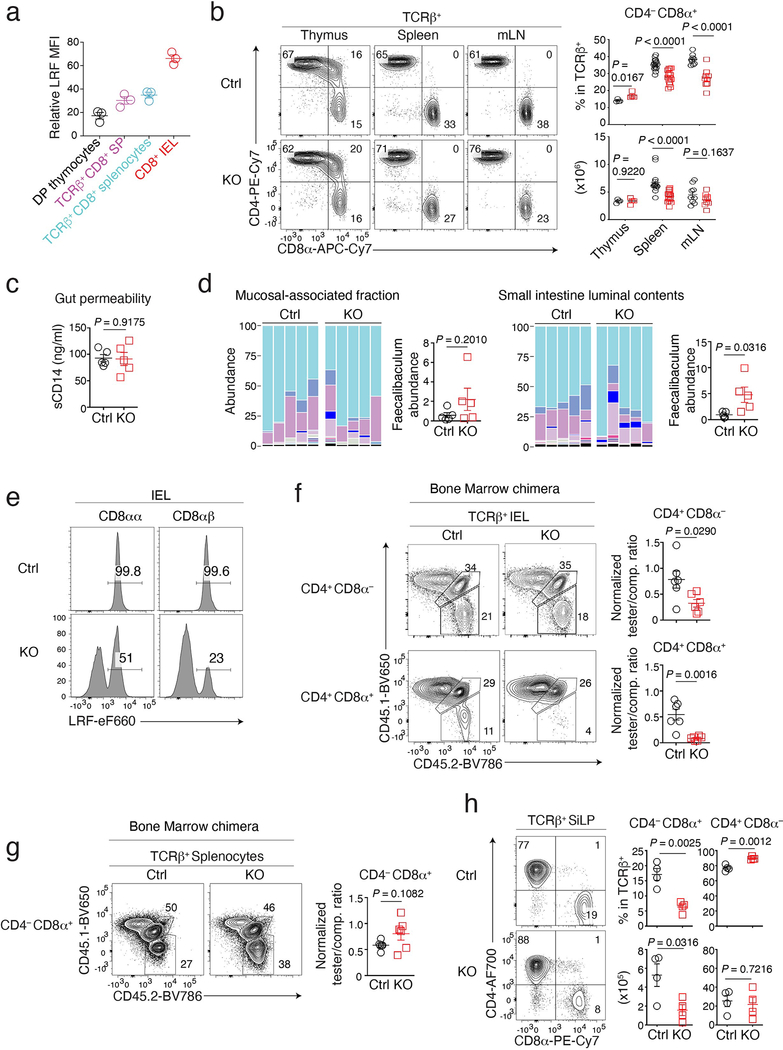
Extended Data Fig. 1. Characterization of LRF KO mice.
(a) LRF expression (MFI) of indicated cells in Fig. 1a relative to LRF MFI in LRF-KO CD8+ splenocytes, set to 1. Data summarizes two independent experiments with a total of three mice.
(b) (left) CD8α vs. CD4 expression on TCRβ+ cells in thymus, spleen, and mLN from Ctrl and LRF KO mice.(right) Number (bottom) and percentage (among TCRαβ+ cells) of CD4−CD8α+ T cells. Data summarizes five independent experiments with a total of 4 (thymus), 16 (spleen), and 9 (mLN) mice of each genotype.
(c) Serum concentration of soluble CD14 (sCD14) in Ctrl (n =5) and LRF KO (n =5) mice. Data summarizes two independent experiments.
(d) Microbial communities in the small intestine luminal contents and mucosal-associated fraction from Ctrl (n = 5) and LRF KO (n = 5) mice. Data are from one experiment representative of two (the other being shown in Fig. 1d), each column representing one mouse. Color code as in Fig. 1d.
(e) Expression of intra-cellular LRF in indicated IEL from Ctrl and LRF KO mice.
(f, g) (left) Expression of CD45.2 vs. CD45.1 in TCRβ+ CD4+ CD8α− and CD4+ CD8α+ IEL (f), and CD4−CD8α+ splenocytes (g) from bone marrow chimera analyzed in Fig. 1e. (right) Tester/competitor ratios in indicated subsets, normalized to tester/competitor ratio of B220+ splenocytes. Data summarizes two independent experiments with a total of 6 mice per group. In (f), tester-competitor ratios (average ± SEM) were 0.78 ± 0.082 (Ctrl) and 0.33 ± 0.031 (KO) for CD4+CD8α− IEL, and 0.54 ± 0.043 (Ctrl) and 0.09 ± 0.008 (KO) for CD4+CD8α+ IEL.
(h) (left) CD8α vs. CD4 expression on lamina propria TCRβ+ cells from Ctrl and LRF KO mice. (right) Percentage (top) and absolute number (bottom) of CD4+ and CD8+ cells among TCRβ+ cells. Data summarizes four independent experiments with a total of 4 mice per genotype.
Error bars indicate standard error of the mean (SEM). P values are from two-tailed unpaired t-test (b, c, d, f, g and h). (a-d, f-h): Each symbol represents one mouse.

