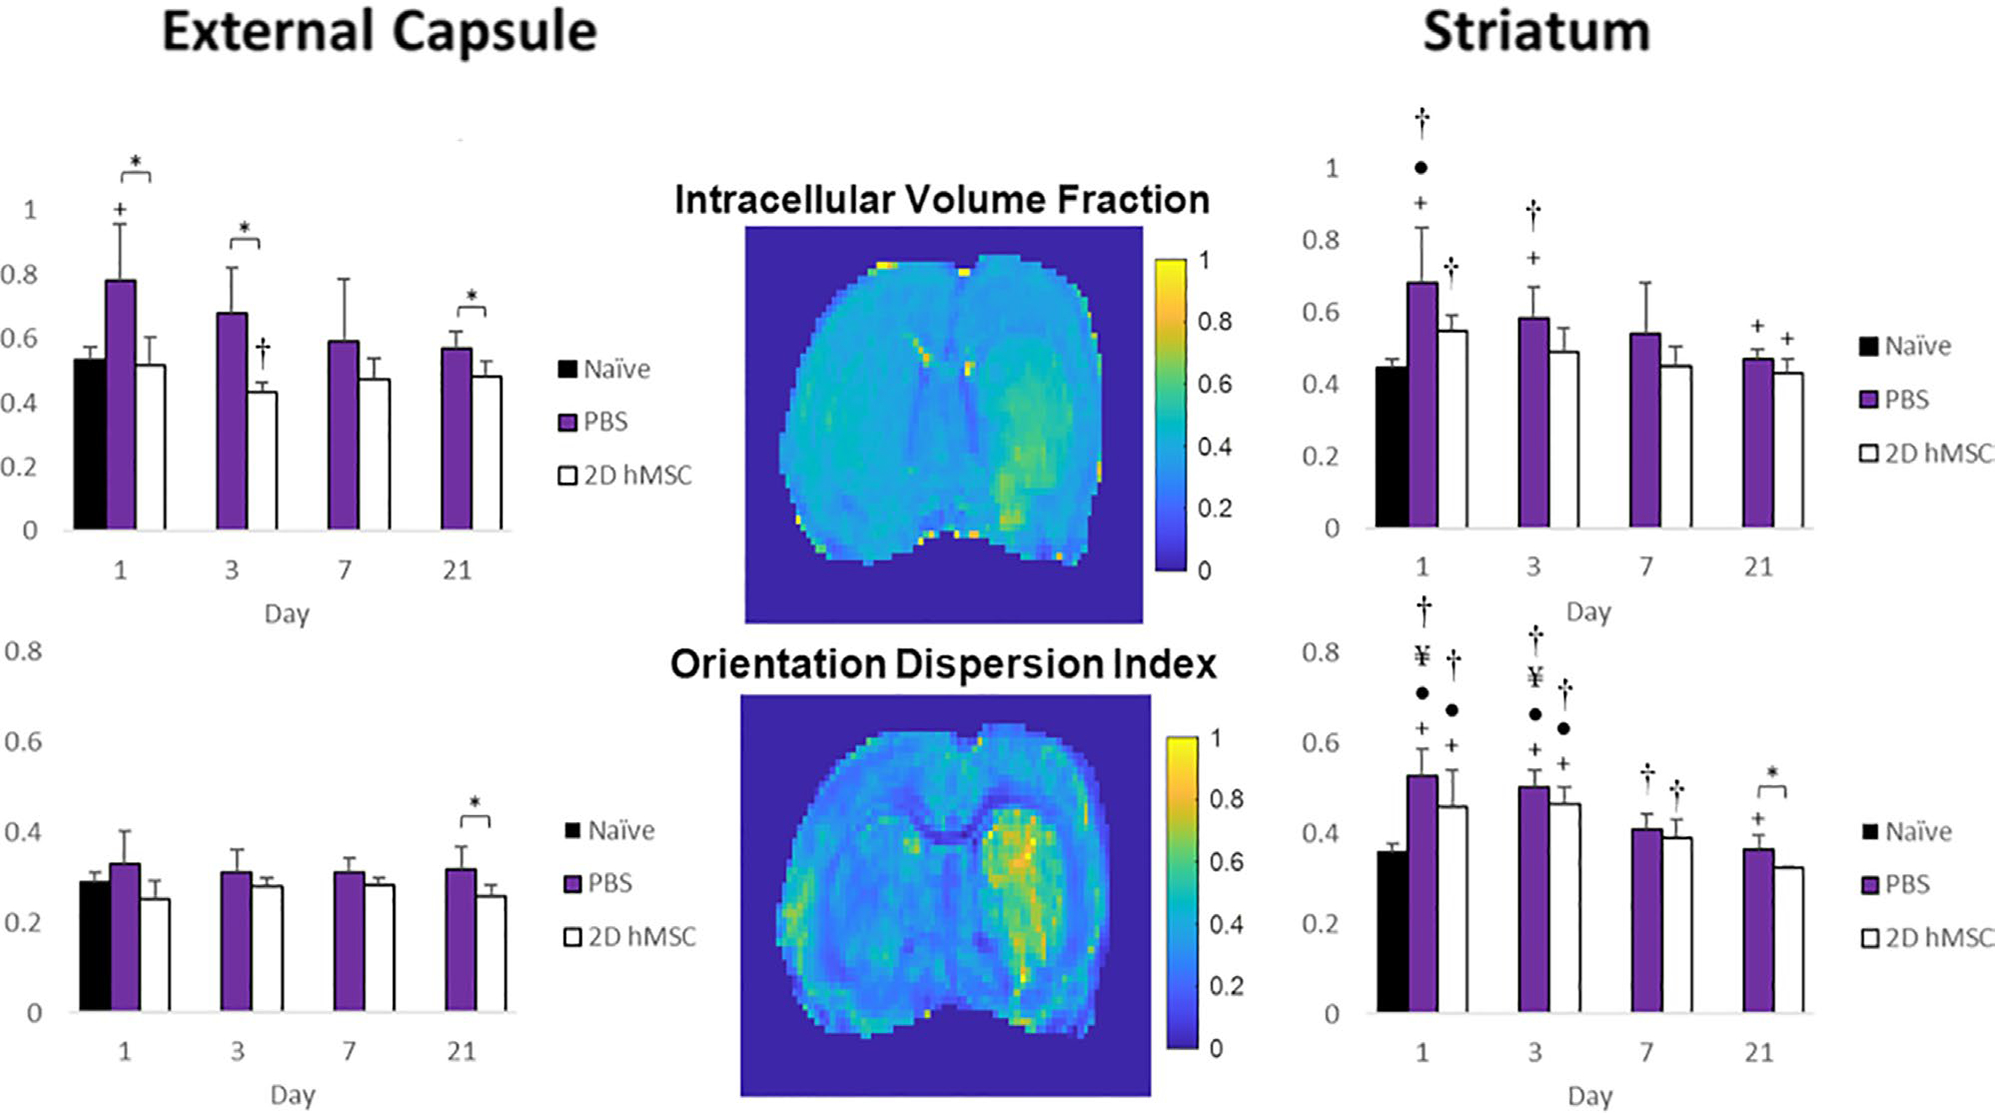
FIGURE 3.

ICVF (A) and ODI (B) for PBS and 2D hMSC-treated animals in the external capsule and striatum. Data displayed as means and standard deviations across all specimens in each group. * = sig diff between treatment groups, + = sig diff between treatment group & naïve, #, ¥, and ● = sig diff between data on labeled time point and day 3, 7, and 21, respectively. † = sig diff between ipsilateral and contralateral hemispheres. P < .05. NODDI metric maps (center) correspond to day 1 of a representative rat that received 2D hMSC treatment after MCAO
