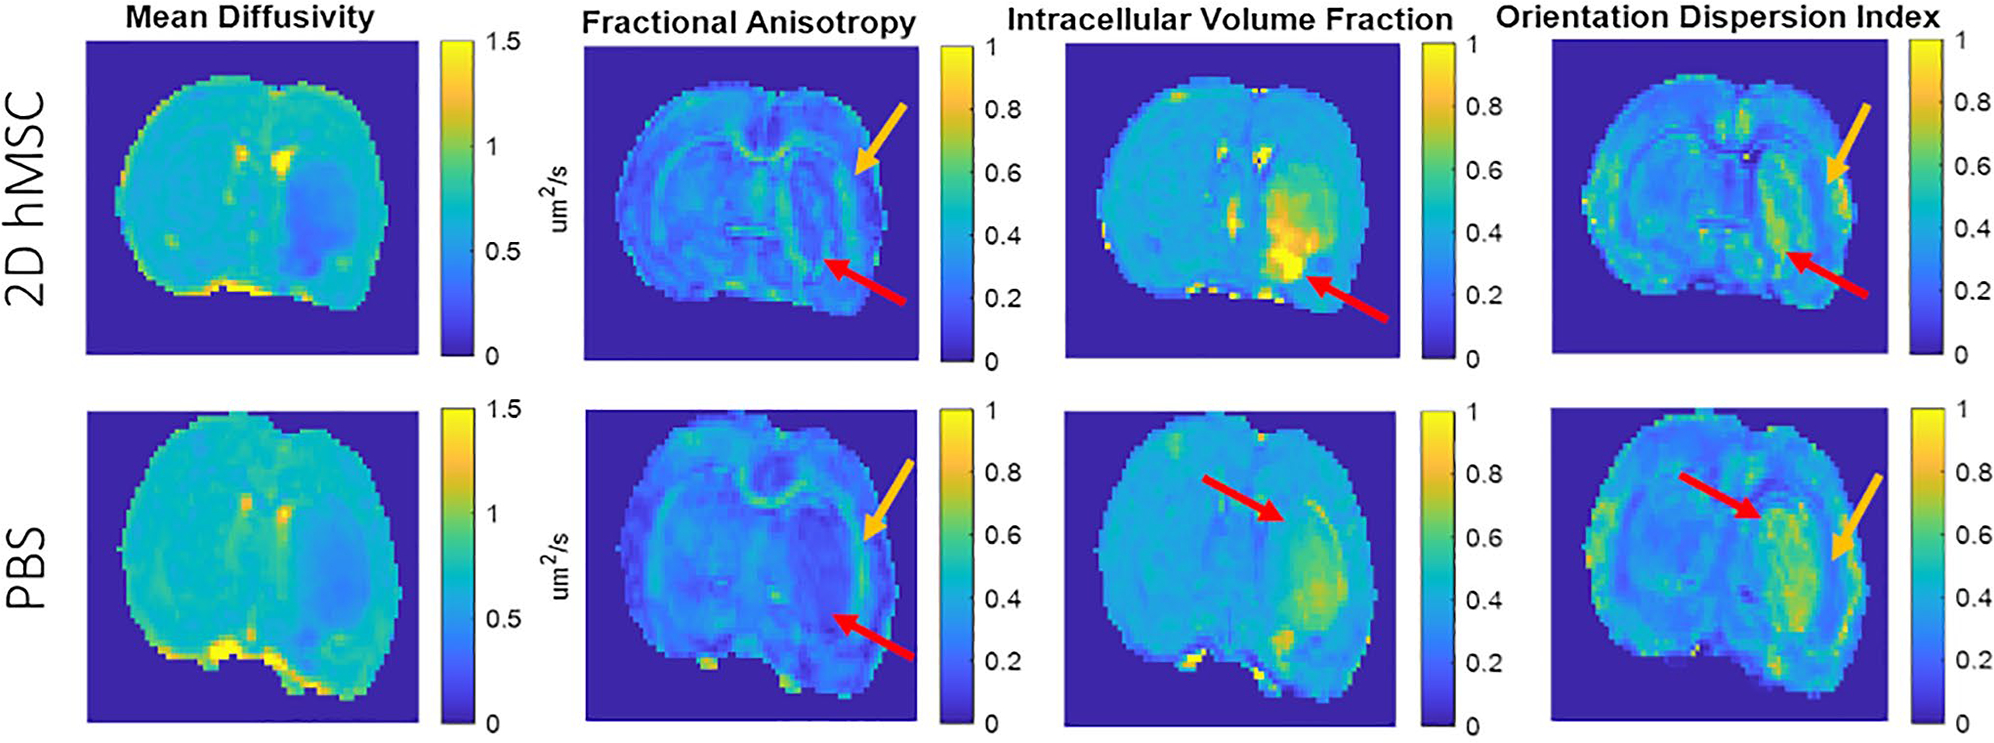
FIGURE 4.

Visual differences observed between DTI and NODDI metrics. Images shown from sample PBS and 2D hMSC-injected rats on day 1. Red arrows indicate inhomogeneous regions within the lesion that appear distinct compared to other regions within the same animal, while gold arrows indicate apparent differences at the interface between white and gray matter
