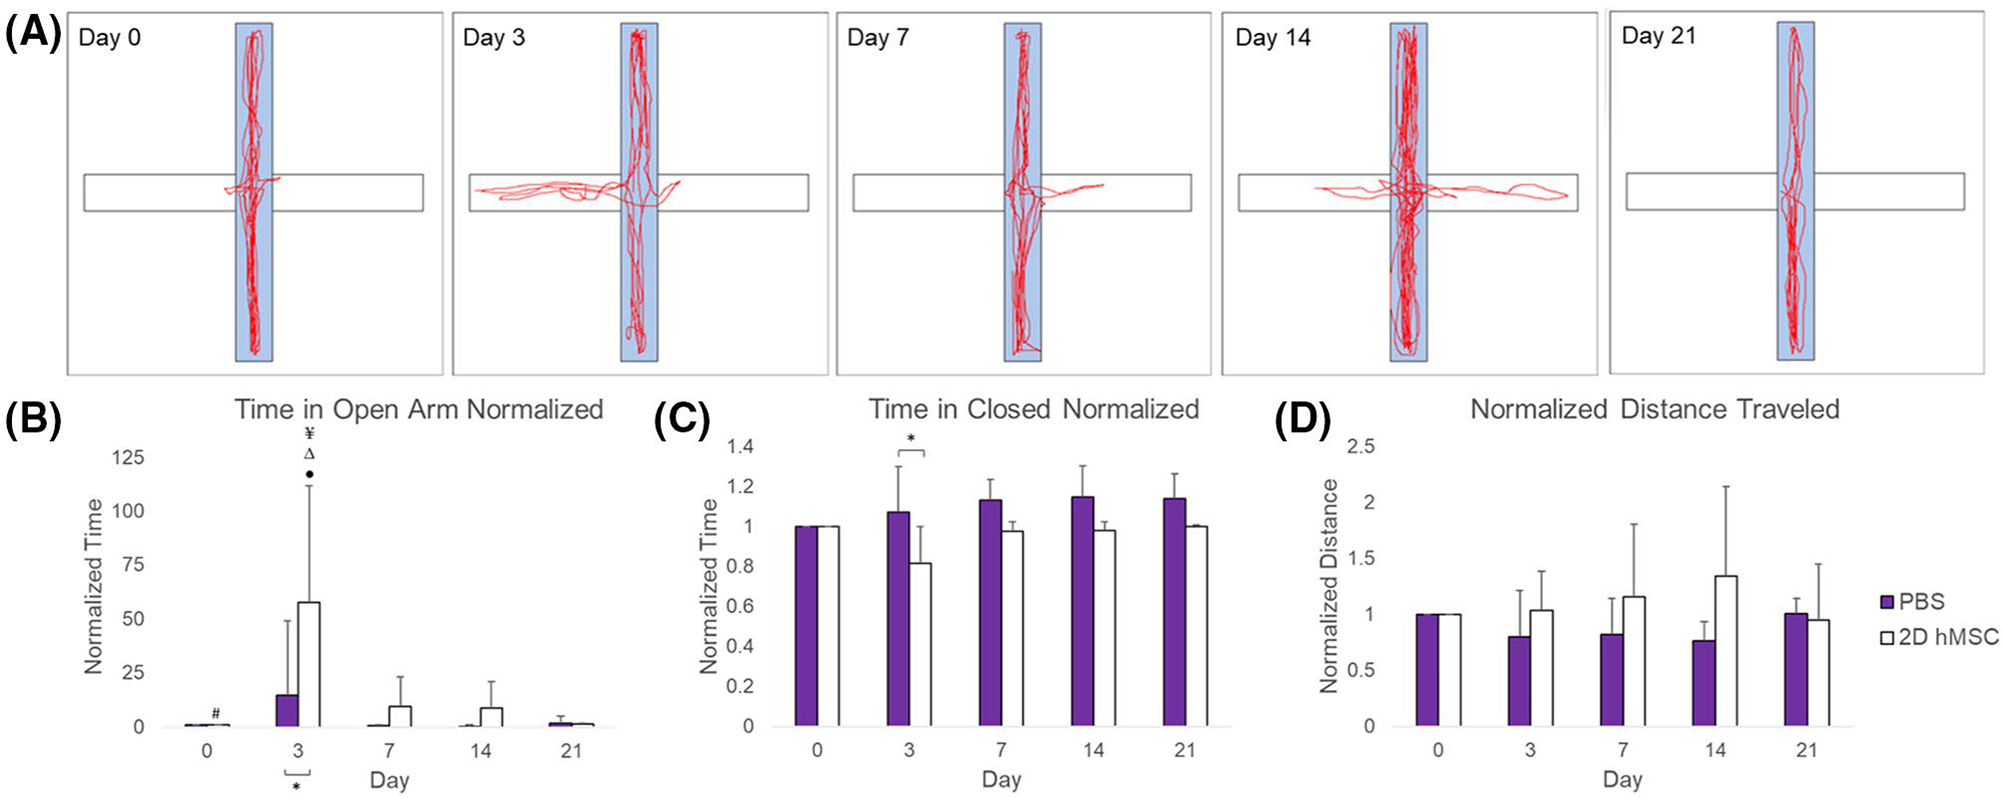
FIGURE 5.

EPM results: Sample diagram of hMSC-treated rat behavior in EPM over 21 days (A), time spent in open arm (B), time spent in closed arm (C),and distance traveled (D), all normalized to baseline measures. Data displayed as means and standard deviations across all specimens in each group. * = sig diff between treatment groups, + = sig diff between treatment group & naïve, #, ¥, Δ, and ● = sig diff between data on labeled time point and day 3, 7, 14, and 21, respectively. P < .05
