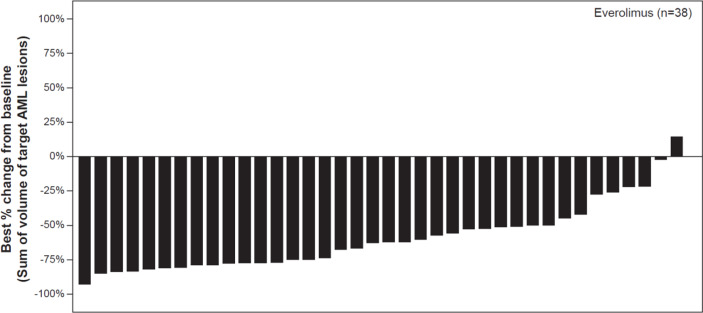
Figure 1.
Waterfall plot of best percentage change from baseline in the sum of volumes of target angiomyolipoma lesions as per central radiology review. Decrease in best percentage change from baseline: 97.37%. Increase/zero change in percentrage change from baseline: 2.63%. *% change in sum of volumes of target AML lesions contradicted by overall AML response = PD: 0%. Patients for whom the best % change in sum of voumes of target AML lesions was not available and patients with overall AML response = Not evaluable were excluded from the graph, percentages above use n as denominator.

