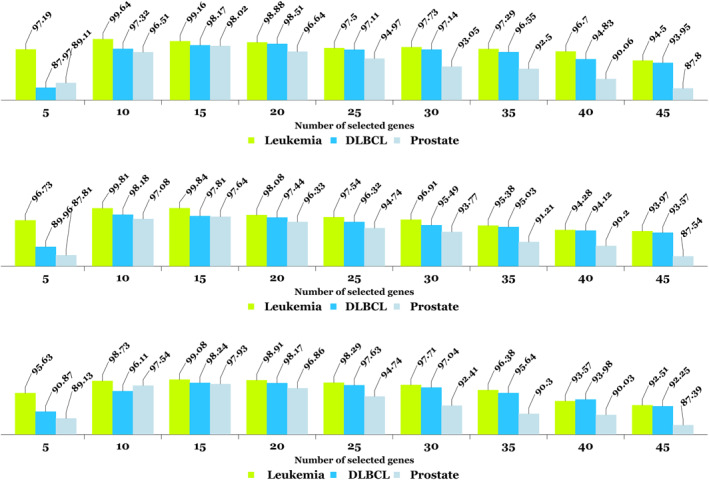
FIGURE 5.

For each of the three microarray datasets, results (per percent) for automatic gene selection and classification are presented via soft ensembling and SAE methods with the fewest number of effective genes in the first, second, and third iterations in row 1, row 2, and row 3, respectively
