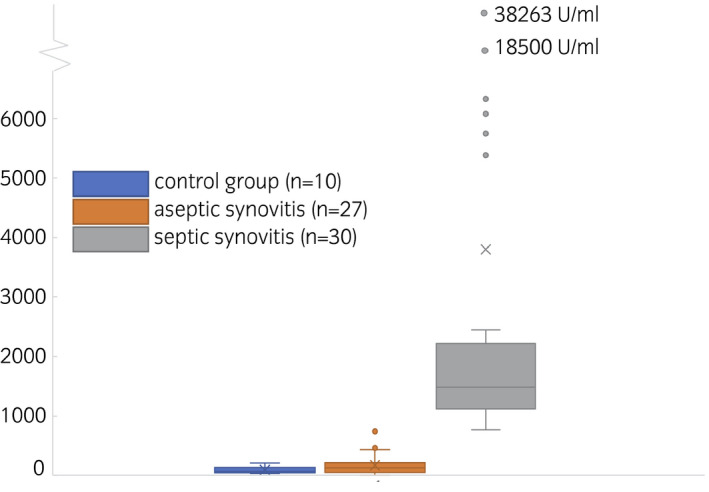
FIGURE 1.

Boxplot of lysozyme activities of control group samples (blue, left), aseptic synovitis samples (orange, middle) and septic synovitis samples (grey, right). Means are indicated as x, medians as lines in the box. Whiskers are defined as max 1.5 times the interquartile range, outliers are visualised as points
