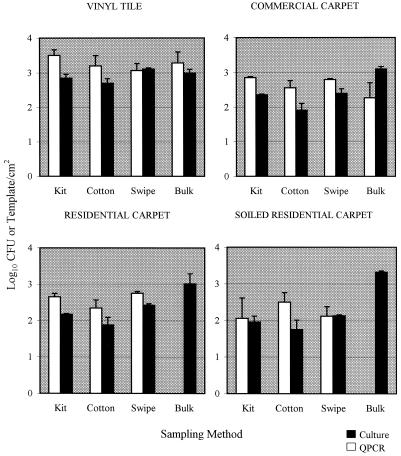
FIG. 2.
Comparison of culture data (log10 CFU per square centimeter) and QPCR data (log10 templates per square centimeter) obtained from samples of B. subtilis subsp. niger-contaminated flooring materials obtained with four sampling methods. The bar heights represent means based on three samples; the error bars indicate standard errors. Kit, swab kit; Cotton, cotton swab; Swipe, sponge swipe.

