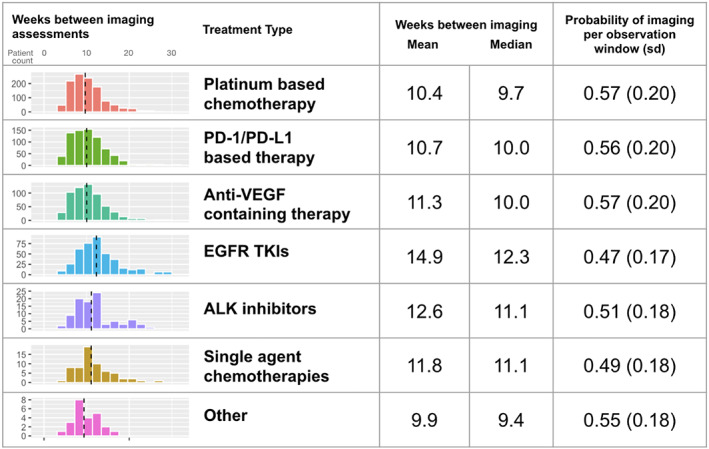
FIGURE 2.

Descriptive statistics for the frequency of imaging assessments among real‐world patients with aNSCLC on first‐line therapy, both for the length of the interval between assessments and the probability of assessment in pre‐defined observation windows. Dashed vertical lines represent the median. “Other” category includes other minor therapy classes with less than 20 patients
