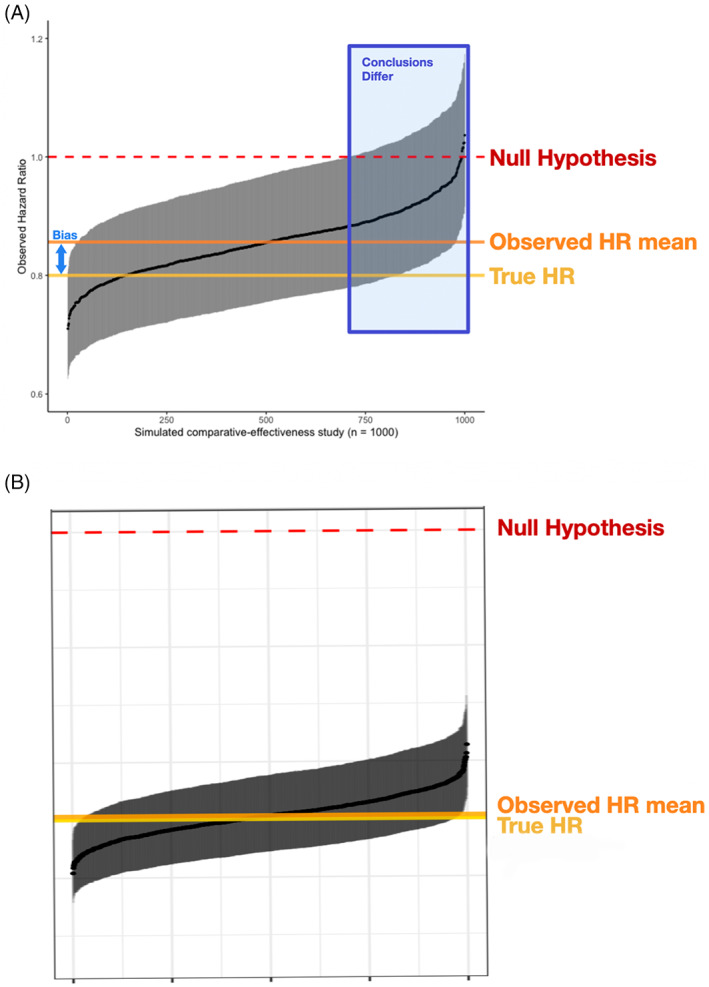
FIGURE 3.

Results from simulated comparative‐effectiveness studies for A, the primary simulation and B, a case study based on real‐world assessment frequencies. Black points represent the observed HR for each study with 95% CI bars in gray, horizontal orange line compared to true HR at yellow line. The 1000 studies are ordered by observed HR along the x‐axis
