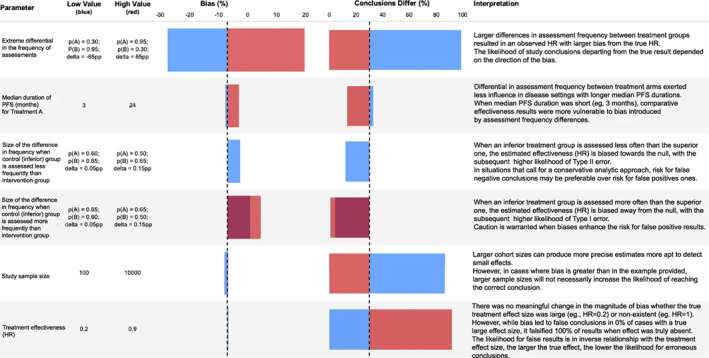
FIGURE 4.

Key considerations influencing susceptibility to surveillance bias from differential imaging assessment frequency in comparative‐effectiveness studies, based on one‐way sensitivity analysis results. The one‐way sensitivity analysis calculates results for the upper and lower range of a parameter while holding all other parameters fixed. The horizontal axis dashed line represents the value estimated in the main analysis. HR, hazard ratio; PFS, progression free survival; pp, percentage points of mean relative percent bias in observed versus true hazard ratio
