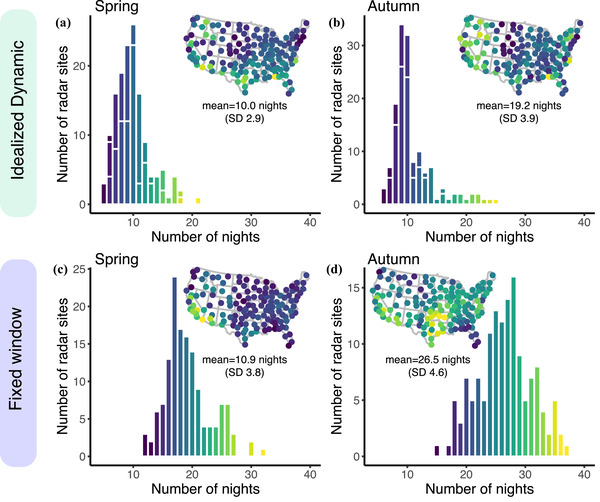
FIGURE 3.

Mean number of nights required to dynamically capture 50% of migration activity in an idealized setting in (a) spring and (b) autumn and (c) spring and (d) autumn mean fixed window that historically captures 50% of migration activity (color scales vary)
