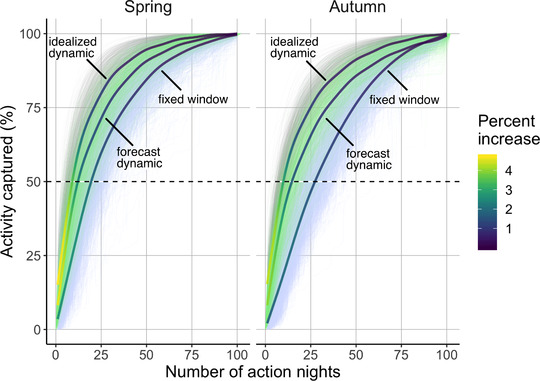
FIGURE 6.

Relationship between number of action nights and migration activity captured for idealized dynamic, forecast dynamic, and fixed window selection (i.e., gray, green, and blue, respectively) in spring and autumn (lines, annual cumulative migration traffic rates for individual weather surveillance radar stations from spring of 2010 to spring of 2018). Each method is fitted with a generalized additive model, and the line shading signifies the rate of increase in percent activity captured
