FIGURE 6.

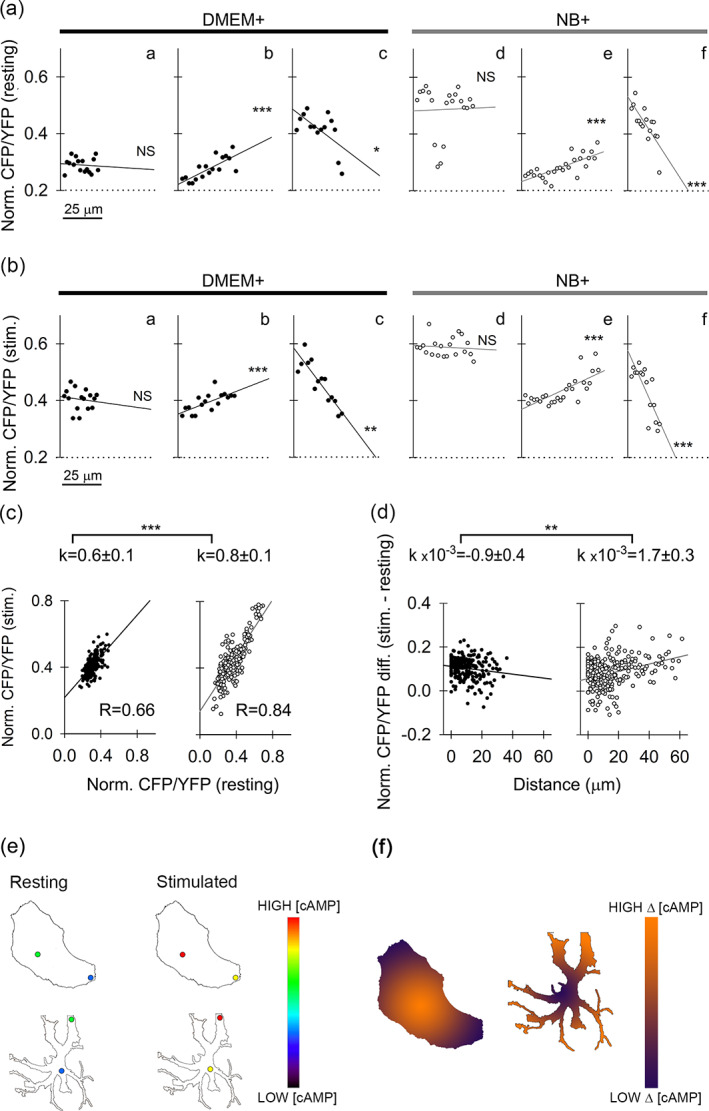
Subcellular [cAMP]i heterogeneity in DMEM+ and NB+ astrocytes. (a), (b) Representative examples of distance‐dependent resting (a) and NA‐evoked (stimulated) (b) changes in [cAMP]i (CFP/YFP ratio, normalized to 0–1, encompassing all ROIs per cell and averaged for 30 s at the beginning and at the end of the signal recording to estimate resting and stimulated [cAMP]i; see Materials and methods) in DMEM+ astrocytes (aa), (ab), (ac), (Ba), (bb), (bc); black circles and regression lines) and NB+ astrocytes (ad), (ae), (af), (bd), (be), (bf); white circles, gray regression lines) along selected directions from the cell nucleus toward the cell periphery/processes. All types of changes that were observed in DMEM+ as well as NB+ cells are displayed: Directions along which [cAMP]i did not change with distance from cell nucleus (aa, ad, ba, bd), directions along which [cAMP]i significantly increased with distance from the nucleus (ab, ae, bb, be) and directions along which [cAMP]i significantly decreased with distance from the nucleus (ac, af, bc, bf). Typically, a significantly positive or negative trend observed in resting conditions was also mirrored after cell stimulation (ab)‐(bb), (ac)‐(bc), (ae)‐(be), (af)‐(bf). (c) Graphs displaying normalized resting values plotted versus normalized NA‐stimulated values reveal a high degree of correlation, especially in NB+ cells (R = 0.84). This means that cells with higher resting [cAMP]i will likely end up with a relatively higher [cAMP]i after NA stimulation. Both DMEM+ (black circles, black regression line) and NB+ (white circles, gray regression line) slopes were significantly positive (p < .001, Student's t‐test), and significantly different from each other (p < .001, Student's t‐test). (d) Relationship between the difference in normalized values of stimulated‐resting CFP/YFP ratio and the distance from the nucleus. DMEM+ cells (black circles, black regression line) display a statistically significant negative trend with a low negative slope coefficient, meaning that capacity for NA‐stimulated cAMP production weakens in the direction from the cell nucleus toward the periphery. In contrast, NA‐stimulated cAMP production in NB+ cells increases in the direction from the cell nucleus (white circles, gray regression line), and the regression line displays a positive slope. (e) Simplified drawings of a DMEM+ (top) and NB+ astrocyte (bottom) in resting and stimulated states with two circular regions symbolically depicting microdomains where cAMP concentration was measured (to obtain data represented in panel c). Cold colors in the pseudo‐color intensity scale indicate regions with lower, whereas warmer colors indicate regions with higher [cAMP], respectively. (f) Simplified drawings of a DMEM+ (left) and NB+ astrocyte (right) depicting region‐dependent difference (Δ) between stimulated and resting [cAMP] microdomain data represented in panel d. Low difference between the stimulated and the resting [cAMP] is displayed by violet, whereas high difference by an orange color on the pseudo‐color intensity scale
