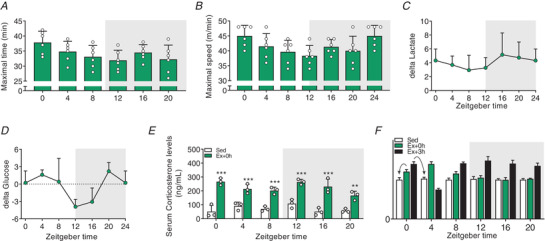
Figure 2. Time‐of‐day‐dependent fluctuations in exercise performance and exercise‐induced corticosterone release.

A, maximal time reached at exhaustion. B, maximal speed reached at exhaustion. C and D, delta blood lactate (C) and delta glucose levels (D) (resting values subtracted from values at exhaustion). E, serum corticosterone levels in Sed and at exhaustion. Light and dark periods are depicted by white and grey background, respectively. Data are shown as the mean ± SD (n = 3). ** P < 0.01, *** P < 0.001, one‐way ANOVA (D). F, mock dataset to illustrate the analysis of the gene expression data depicted in Figs 3 and 4. Fold‐change (FC) values are plotted according to time at which exercise was started. FC estimation was performed according to the time of sacrifice (i.e. as indicated by the arrows: gene expression data of mice exercised from ZT0 and sacrificed directly at exhaustion are expressed relative to Sed ZT0 plotted at ZT0; and the gene expression of mice exercised at ZT0 and sacrificed 3 h after exhaustion are expressed relative to Sed ZT4, but plotted at ZT0). [Colour figure can be viewed at wileyonlinelibrary.com]
