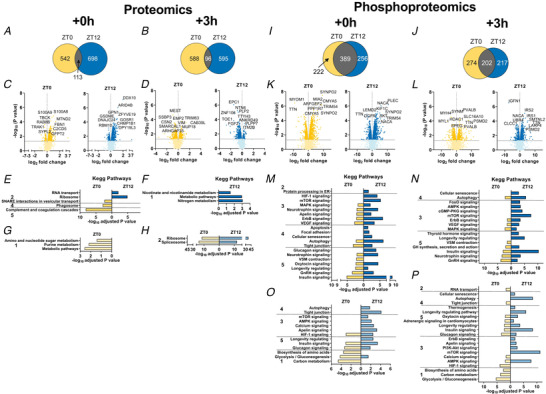
Figure 7. Phospho‐/proteomic analyses reveal time‐dependent differences in muscle response to early daytime vs. early night‐time exercise.

A and B, Venn diagrams displaying the number of differentially regulated proteins immediately (A; Ex + 0 h) and 3 h (B; Ex + 3 h) after early daytime (ZT0) or early night‐time (ZT12) exercise, and resulting overlap. C and D, volcano plots showing the differentially regulated proteins (with top 10 indicated) as above. E–H, KEGG analysis of up‐regulated (E and F) and down‐regulated (G and H) proteins by exercise as described above. I–L, Venn diagrams (I and J) and volcano plots (K and L) displaying the differentially phosphorylated proteins in the same groups as above. M–P, KEGG analysis (top 5 terms per category) for increased (M and N) and decreased (O and P) protein phosphorylation in Ex + 0 h and Ex + 3 h groups. KEGG pathway categories: 1, metabolism; 2, genetic information processing; 3, environmental information processing; 4, cellular processes; 5, organismal systems. [Colour figure can be viewed at wileyonlinelibrary.com]
