
Figure 10. Distinct muscle gene expression signatures after daytime vs. night‐time wheel running training.
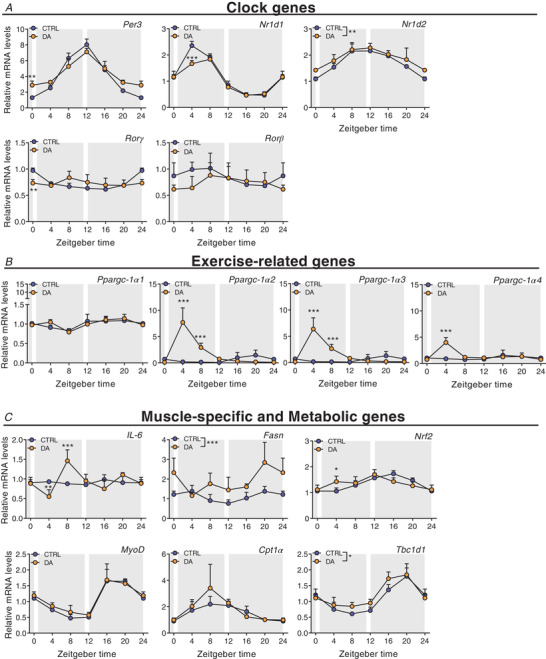
Gene expression in control (CTRL) and daytime activity (DA) mice. A, clock genes. B, exercise‐related genes. C, muscle‐specific and metabolic genes. Expression values were determined by qPCR and normalized to Hprt. Light and dark periods are depicted by white and grey background, respectively. Data are shown as the mean fold‐change ± SD (n = 4) relative to the expression in CTRL ZT0 set to 1. * P < 0.05, ** P < 0.01, *** P < 0.001, one‐way ANOVA. [Colour figure can be viewed at wileyonlinelibrary.com]