
FIGURE 2.
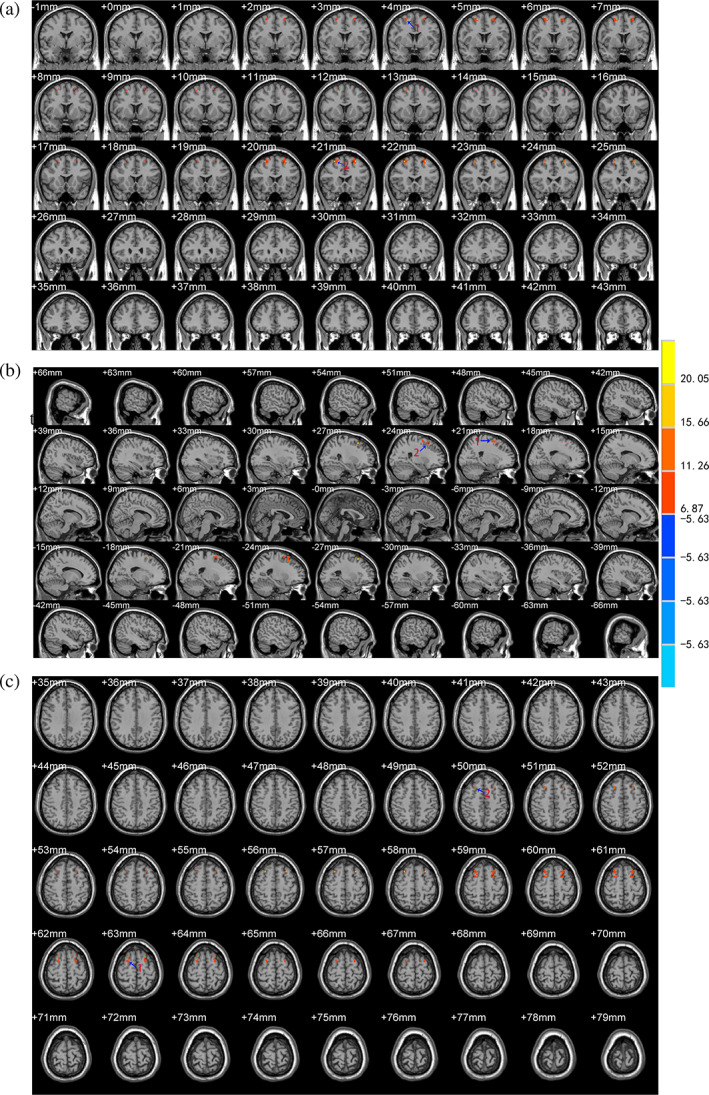
Brain areas with differences in the VMHC values between the two groups after treatment. The letter (a) represents the coronal position of the VMHC analysis results, (b) represents the sagittal position, and (c) represents the horizontal position. The color bar on the right side of the figure represents the intensity of activation in the brain area. The numbers represent different brain regions for VMHC: 1. BA6, 2. BA8