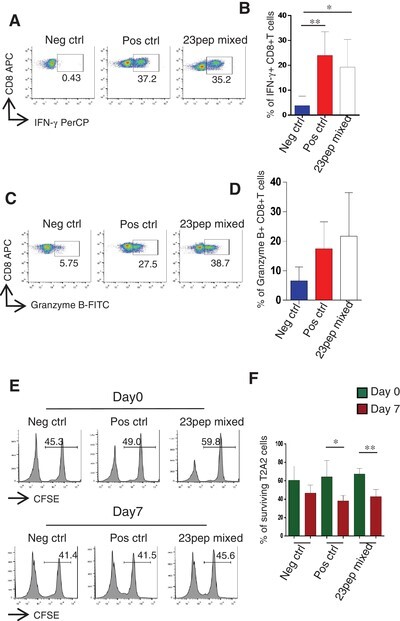
FIGURE 4.

The cytotoxicity of HLA-A2 restricted severe acute respiratory syndrome-coronavirus 2 (SARS-CoV-2) specific CD8+ T cells. (A) Representative FACS plots of IFN-γ staining of CD8+ T cell after stimulation with the mixed candidate peptides for 7 d. (B) The histogram analysis of (A) (n = 4). (C) Representative FACS plots of granzyme B staining of CD8+ T cells after stimulation with the mixed candidate peptides for 7 d. (D) The histogram analysis of (C) (n = 3). (E) The proportion of surviving T2A2 cells on day 0 and day 7. (F) The histogram analysis of (E) (n = 4). Statistical significance was determined with two independent sample t-tests, *P < 0.05, **P < 0.01. Neg ctrl: T2A2 cells without peptide loading; Pos ctrl: T2A2 cells loaded with influenza A M1 peptide (GILGFVFTL)
