
FIGURE 3.
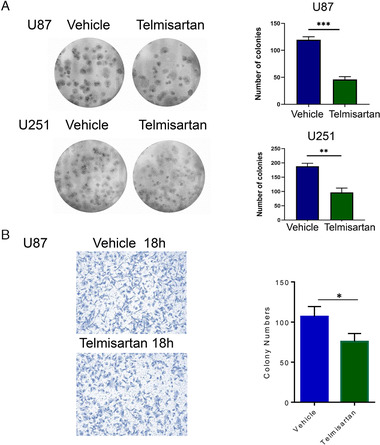
Telmisartan decreases the oncogenicity of GBM cell lines. (A) Cells with the telmisartan treatment have less colonies formations compared to the vehicle groups. Left panel shows the representative colony formation pictures of telmisartan treatment group and control group. Colonies were grown for 3 weeks, and then foci were counted and photographed. The right panel shows the statistical analysis. Each experiment had three replicates. The error bar represents SD; **p < 0.01 and ***p < 0.001. (B) Pictures taken after 18 h of transwell assay, and the statistical results, *p < 0.05